Fundamentals of Bioinformatics - Ogurtsov A.N. 2013
Foundations of Bioinformatics
Examples of Data Comparison
Examples of Bioinformatic Analysis
Let us now examine several real-world Examples of sequence retrieval from a database and Biological Sequence Alignment for subsequent analysis.
Example 1. Retrieve the Amino Acid Sequence of horse pancreatic Ribonuclease.
We use the UniProt (Universal Protein Resource) server to access Databases such as EMBL, GenBank, DDBJ, etc.: http://www.uniprot.org/.
Enter the Swiss-Prot identifier for horse pancreatic ribonuclease, RNPHORSE, into the search field (Figure 23) and click "Search".
Class="center">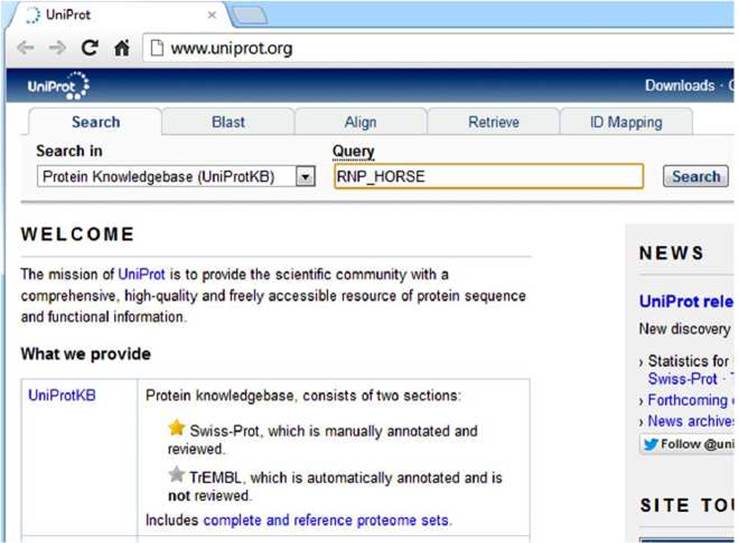
Figure 23 - UniProt web page
The search results are shown in Figure 24.
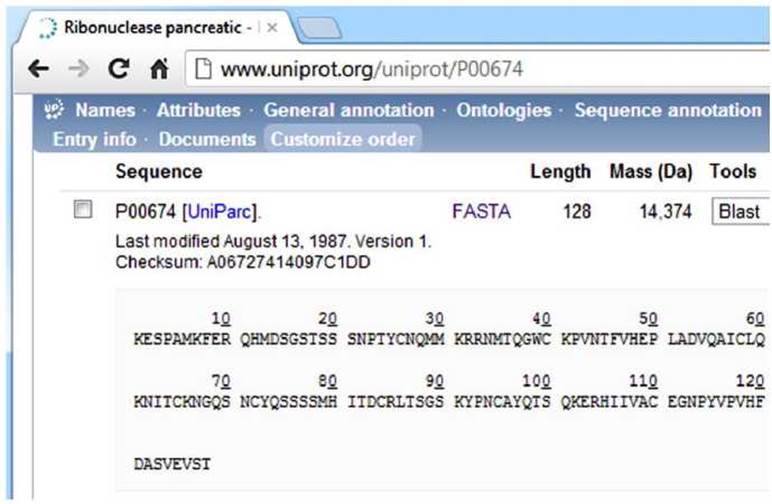
Figure 24 - Search results for The amino acid sequence of horse pancreatic ribonuclease
Next, in the same window (Figure 24), click the "FASTA" button to obtain the amino acid sequence of horse pancreatic ribonuclease in FASTA format.
The result is shown in Figure 25.
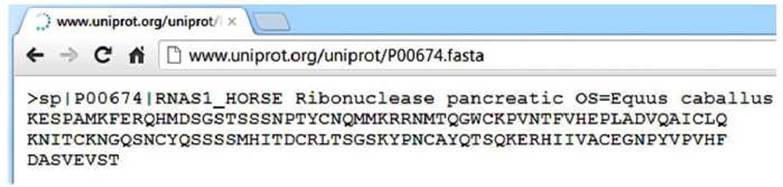
Figure 25 - Amino acid sequence of horse pancreatic ribonuclease in FASTA format
This result can be copied to the computer's clipboard and pasted into other programs.
Example 2. Using the same method, retrieve and then align the pancreatic ribonucleases of the horse (Equus caballus), the common minke whale (Balaenoptera acutorostrata), and the red kangaroo (Macropus rufus).
Enter the Swiss-Prot identifiers for the pancreatic ribonucleases of the horse (RNAS1_HORSE), the minke whale (RNAS1_BALAC), and the red kangaroo (RNAS1_MACRU) one by one into the UniProt search window (Figure 23).
By clicking the "FASTA" button in the results window (Figure 24), we obtain the sequences in FASTA format.
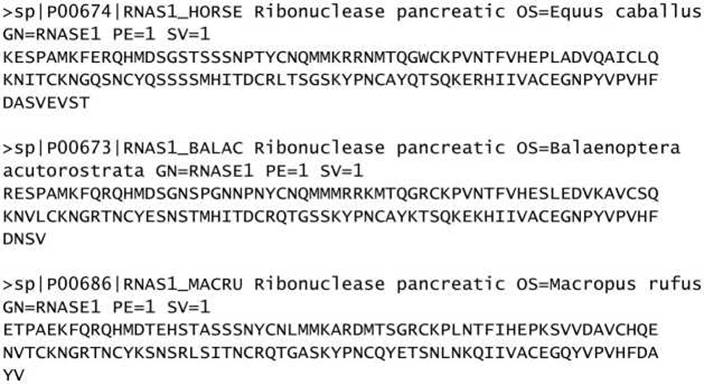
Then we copy them into a single text (ASCII) file.
The FASTA description for the ribonucleases of the horse (Equus caballus), the common minke whale (Balaenoptera acutorostrata), and the red kangaroo (Macropus rufus) is as follows:
Let us generate a Multiple Sequence Alignment for these sequences using the ClustalW2 program (Figure 26)
http://www.ebi.ac.uk/Tools/clustalw2/index.html
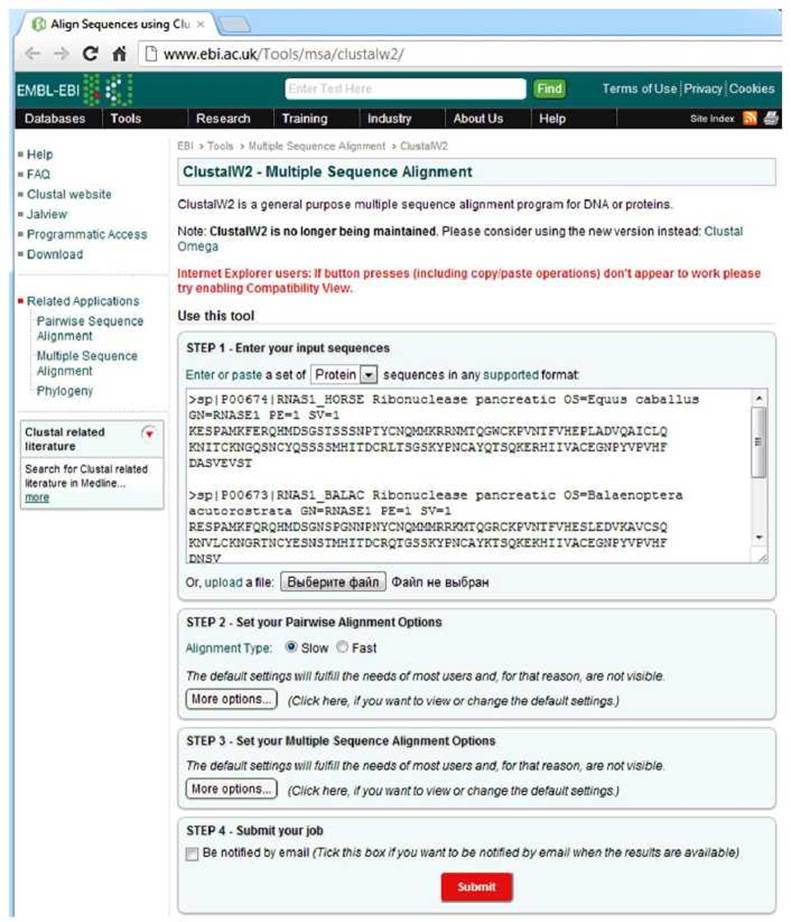
Figure 26 - ClustalW2 window with loaded task parameters
The result of the multiple sequence alignment for RNAS1_HORSE, RNAS1_BALAC, and RNAS1_MACRU is presented in Figure 27.
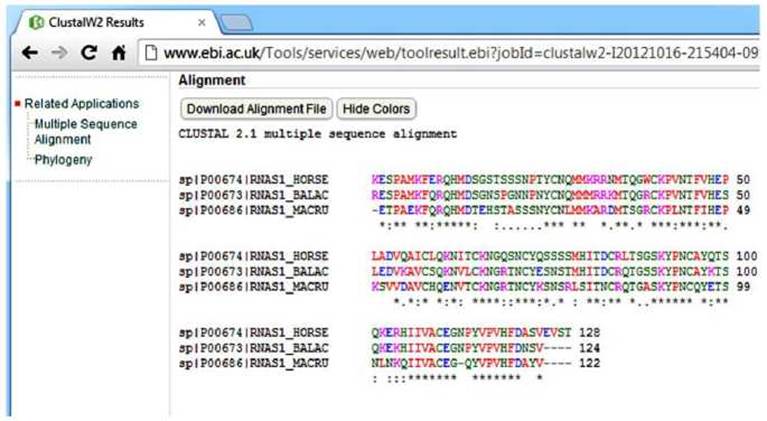
Figure 27 - Result of the multiple sequence alignment of Amino acid sequences of pancreatic endonucleases from horse, minke whale, and red kangaroo
The color-coded amino acid symbols in Figure 27 appear after clicking the "Show Colors" button in the program window. In the bottom (consensus) row beneath the sequences in the alignment table, the symbols denote the following:
"*" - conserved (identical across all sequences) amino acid;
":" - Amino Acids with strongly similar physicochemical properties;
"." - amino acids with weakly similar physicochemical properties;
" " - a gap indicating a lack of similarity.
Symbols within the amino acid sequences indicate insertions automatically added by the program for optimal alignment. Large Regions of the sequences are identical; there are numerous substitutions, but only a single internal deletion.
Let us now perform a pairwise sequence alignment. The results of the pairwise alignment are shown in Figure 28:
a) horse and minke whale;
b) minke whale and red kangaroo;
c) horse and red kangaroo.
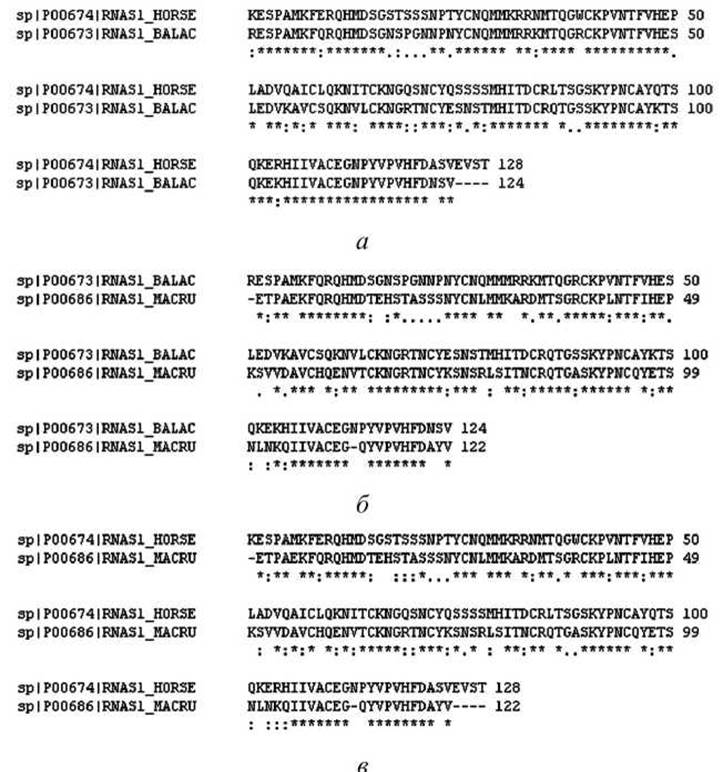
Figure 28 - Results of the pairwise sequence alignment of amino acid sequences of pancreatic endonucleases from horse, minke whale, and red kangaroo
Upon pairwise sequence comparison, the number of identical residues between pairs in this alignment is presented in Table 4.
Table 4 - Number of identical residues in pancreatic endonuclease sequences
|
Horse and minke whale |
95 |
|
Minke whale and red kangaroo |
82 |
|
Horse and red kangaroo |
75 |
The horse and the whale share a higher number of identical residues. This is consistent with the fact that both horses and whales are placental mammals, whereas the kangaroo is a marsupial.
Thus, even the simplest structural sequence analysis via alignment demonstrates Structure/19.html">The Importance of this Procedure for estimating evolutionary relatedness and Phylogenetic relationships among organisms.
Example 3. Two extant genera of elephants are represented by the African bush elephant (Loxodonta africana) and the Asian elephant (Elephas maximus). Let us compare the amino acid sequences of mitochondrial cytochrome b from these elephants and the extinct Siberian woolly mammoth (Mammuthus primigenius).
We search for the amino acid sequences in UniProt (Figure 29).
The retrieved Swiss-Prot identifiers—CYB_LOXAF, CYB_ELEMA, and CYB_MAMPR—are used to retrieve the sequences and obtain them in FASTA format.
The FASTA description of these Cytochromes is as follows:

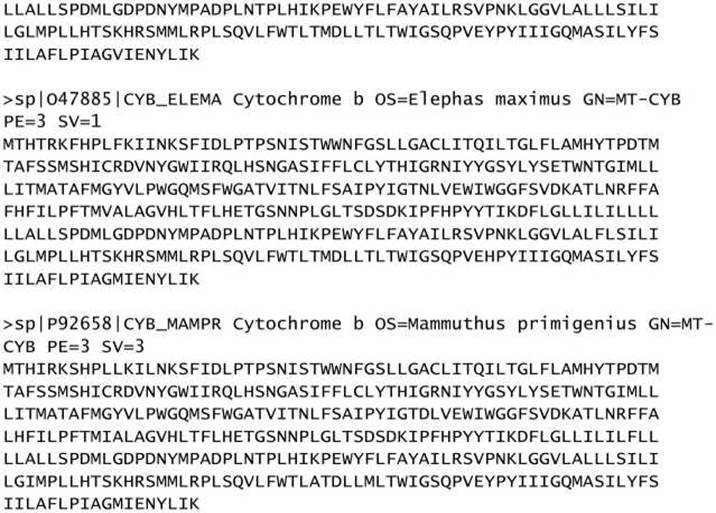
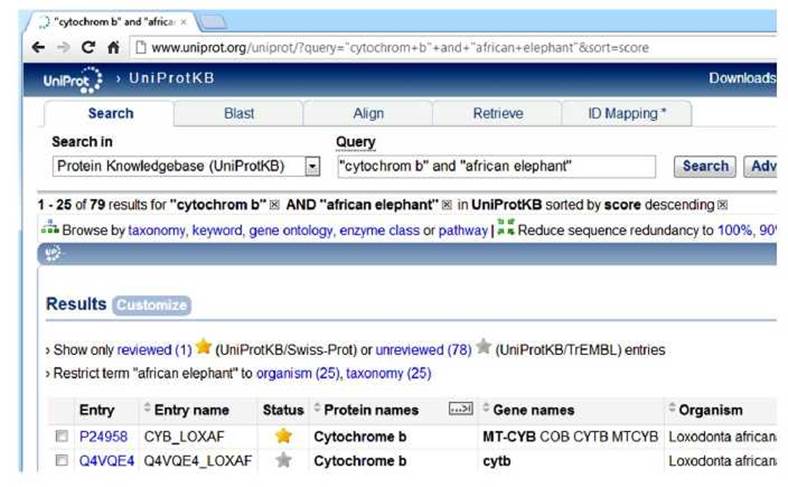
Figure 29 - Search results for the cytochrome b identifier of the African bush elephant (*Loxodonta africana*) in the Swiss-Prot database
We copy these three sequences into the ClustalW2 program window (http://www.ebi.ac.uk/Tools/clustalw2/index.html) and perform alignment, yielding the following result:
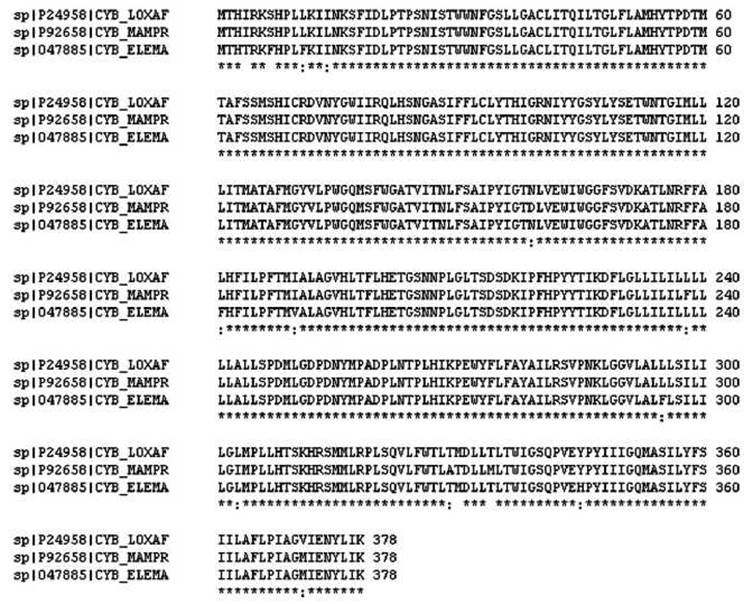
The mammoth and African elephant sequences exhibit 10 mismatches, whereas the mammoth and Asian elephant sequences show 14 mismatches. This indicates that the mammoth is more closely related to the African elephant. This raises the question: are such differences biologically significant?
Let us discuss this example in greater detail. A simple visual inspection suggests that African elephants, Asian elephants, and mammoths should be close relatives.
First question: can we determine solely from these sequences that they belong to closely related species?
Second question: do these minor differences represent evolutionary divergences driven by Selection, or are they simply random noise or stochastic variation?
A sensitive statistical criterion is required to determine The Significance of matches and mismatches.
To clarify these issues, two concepts are employed: similarity and Homology.
Similarity refers to the presence or quantification of likeness and difference, regardless of THE ORIGIN OF that similarity.
Homology means that the sequences and the organisms in which they are found are descendants of a common ancestor, implying that the ancestral forms possessed similar characteristics.
Sequence similarity (or macroscopic biological traits) can be assessed through sequence alignment without invoking any historical hypotheses.
Conversely, a statement of homology is a statement about historical events that are almost invariably obscured. Homology must be inferred as a hypothesis arising from the observation of similarity. Only in rare instances can homology be directly observed: for example, in a family pedigree demonstrating an unusual phenotype such as the Habsburg jaw, in a laboratory population, in clinical trials, or during the monitoring of viral infections at the sequence level in individual patients (see also section 10.1).
The assertion that the cytochromes b of African elephants, Asian elephants, and mammoths are homologous implies the existence of a common ancestor that likely possessed a unique cytochrome b, which subsequently gave rise to the Proteins of mammoths and modern elephants through divergent Mutations. Does a high degree of sequence similarity prove homology, or are there alternative explanations?
✵ It is possible that functional cytochrome b contains so many conserved regions that the cytochromes b of other animals are inherently as similar to one another as those of the elephant and mammoth. We can test this hypothesis by examining the sequences of this protein in other species. As it turns out, the cytochromes b of other animals differ quite significantly from those of elephants and mammoths.
✵ A second possibility is that specific functional constraints govern optimal cytochrome b activity in elephant-like animals, and that the three cytochrome b sequences originate from three distinct ancestors, with a common selective pressure driving them to converge in sequence. (Recall that our Conclusions are based exclusively on the analysis of cytochrome b sequences).
✵ The mammoth may indeed be more closely related to the African elephant, but since their last common ancestor, the cytochrome b sequence of the Asian elephant evolved at a faster rate than those of the African elephant and mammoth, accumulating a greater number of mutations.
✵ A fourth hypothesis posits that all common ancestors of elephants and mammoths possessed widely divergent cytochromes b, and that extant elephants and mammoths propagated a shared Gene via horizontal transfer from unrelated organisms mediated by Viruses.
Suppose we have proven that the similarity between the elephant and mammoth cytochrome b sequences constitutes sufficient evidence of homology; how are we then to interpret the ribonuclease sequences from the previous example? Do the substantial differences among the pancreatic ribonucleases of the horse, whale, and kangaroo prove that they are non-homologous?
It is impossible to answer these questions based solely on sequence alignment data.
Specialists carefully calibrate sequence Similarities and differences across numerous proteins from various species whose taxonomic positions have already been established by classical Methods.
In the case of pancreatic ribonucleases, reasoning from similarity to homology is entirely justified.
The question of whether mammoths are more closely related to African or Asian elephants remains unresolved, even when accounting for all available anatomical evidence and sequence similarities.
Today, sequence similarity analysis is universally recognized and considered the most reliable method for establishing phylogenetic relationships—despite the fact that, occasionally (as in the case of elephants), the results may be inconclusive or, in other instances, even yield incorrect Answers. A wealth of data and powerful tools are readily available to address specific research problems, alongside numerous analytical suites.
However, machine analysis will never replace a meaningful scientific Discussion among professionals.
Last update: 11/08/2026
Editorial and Educational Adaptation: This material has been compiled based on the primary/original source text. The project team performed an editorial review, corrected technical inaccuracies, structured sections, and adapted the content for an educational format.
What was processed:
- elimination of formatting defects (OCR errors, structural breaks, corrupted characters);
- editorial organization of content;
- standardization of terminology in accordance with academic sources;
- verification of factual statements against the original source text.
All mentions of the author, publication year, and origin of the primary text have been preserved in accordance with the source.