Genetics and Fundamentals of Selection - M.P. Myhun - 2008
CHAPTER VI. Population Genetics
6.5. The Hardy-Weinberg Law and Its Practical Application
When studying the Patterns of inheritance of individual traits and determining their genotypes, we essentially model the pathways of trait inheritance using diagrams. In reality, the number of such traits is vastly greater. For instance, The Human Genome contains around 30,000 genes. Within an Organism's genotype, all these genes are capable of mutating, recombining in various ways, and generating a multitude of genetic combinations with other non-allelic genes. Because spontaneous mutation of each Gene occurs continuously across generations at a specific frequency, dominant and recessive alleles are always present in populations. Depending on the Adaptive Value of recessive Mutations, their recombination rates with other genes in the genotype, and METABOLISM/18.html">The Influence of natural Selection, The ratio of dominant to recessive genes can shift over successive generations.
The continuous emergence of new gene combinations within a population does not imply chaos in the Variability of individual traits among its members. On the contrary, these populations maintain a state of equilibrium between the sums of dominant and recessive genes.
In 1908, the English mathematician G.H. Hardy and, independently, the German physician W. Weinberg established that in an ideal population, the equilibrium between the ratios of dominant and recessive genes remains constant across generations. Although ideal populations do not exist in nature, the regularities established for them are highly amenable to precise statistical analysis.
Based on mathematical analysis, Hardy and Weinberg formulated the law: in an ideal panmictic population, the frequencies of alleles, and consequently of genotypes, remain constant from generation to generation.
Thus, The process of inheritance itself does not alter allele frequencies in a population, and any potential changes in its genetic Structure stem from other causes. This is the core principle of the Hardy-Weinberg law, which serves as a fundamental tool for analyzing genetic processes within populations.
The mathematical derivation of this law is based on the premise that allele frequencies determine the frequencies of the corresponding Gametes, which in turn determine genotype frequencies. Hardy and Weinberg proceeded from the fact that genotype frequencies in a population are related to allele frequencies through simple quadratic equations.
If a locus in an ideal panmictic population contains two alleles—a dominant one (A) and a recessive one (a)—and their concentrations (frequencies) are designated as p and q respectively, the sum of these frequencies in the population can be expressed as p + q = 1, whence p = 1 - q and q = 1 - p. The frequencies of gametes carrying alleles A and a will be pA and qa. When these gametes combine randomly under panmixia, the genotype frequency equals (рА + qа)2 = р2АА + 2 pqAa + q2aa, which can be easily demonstrated using a Punnett square:
Class="center">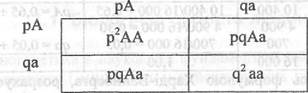
Thus, the sum of the specified genotype frequencies in the population equals р2АА + 2 pqAa + q2аа = 1.
We can easily verify that the frequencies of alleles A and a remain unchanged across generations in an ideal population by substituting specific numbers into the binomial (рА + qa)2. If in the parental generation рА = 0.4 and qa = 0.6, then the genotype frequencies in F1 will be: (0.4A + 0.6a)2 = 0.42АА + 2 * 0.4 * 0.64а + 0.62 аа = 0.16АА + 0.48Аа + 0.36аа
Calculating the gene frequencies of A and a in F1 from the genotype frequencies: рА = 0.16 + 0.48/2 = 0.4; qa = 0.36 + 0.48/2 = 0.6.
Thus, over the course of a single generation, the allele frequencies in the population did not change. Further calculations would confirm that the ratio of A to a remains constant in subsequent generations as well.
As these calculations show, under panmixia, equilibrium in genotype frequencies for any given locus is achieved as early as the first generation. This occurs when the allele frequency ratios in males and females of the parental generation are identical. If they are not (which is common in real populations), equilibrium in allele and genotype frequencies is established over subsequent generations.
Another corollary of the Hardy-Weinberg law is that the lower the allele frequency in a population, the greater the proportion of that allele existing in the heterozygous state,
The Hardy-Weinberg law applies strictly to ideal populations. Obviously, these parameters do not hold true for natural populations, which are constantly subjected to external and internal factors. The degree of disruption of genetic equilibrium in natural populations is determined by applying the Hardy-Weinberg formula to construct a mathematical model of an ideal population and comparing it with empirical data.
Example. During the hunting season, hunters harvested 16,000 fox pelts, comprising 10,400 red foxes (AA), 4,900 cross foxes (Aa), and 700 black foxes (aa). We need to determine whether this population is in a satisfactory condition and whether its commercial harvesting can be considered justified.
To answer these questions, we must determine what the ratio of these three genotypes would be in an ideal population. We construct a mathematical model of an ideal population using the allele frequencies observed in the actual sample.
Let us calculate the frequencies of alleles A and a from the genotype frequencies
Genotype and Phenotype |
Number of Individuals |
Genotype Frequency |
Allele (Gamete) Frequency |
AA (red) Aa (cross) aa (black) |
10 400 4 900 700 |
10 400/16000 = 0.65 4 900/16 000 = 0.30 700/16 000 = 0.05 |
рА = 0.65 + 1/2*0.30 = 0.80 qa = 0.05 + 1/2*0.30 = 0.20 |
Total |
16 000 |
1.00 |
1.00 |
Using the Hardy-Weinberg formula, we calculate the number of individuals belonging to each genotype class in the ideal population.
(рА + qа)2 = р2АА + 2 pqAa + q2 аа
р2АА = (pA)2 * 16 000 = 0.802 *16 000 = 10240
2pqAa = 2 (pA)(qa) * 16 000 = 2*0,8*0,2*16 000 = 5120
q2aa = (qа)2 * 16 000 = 0,22 * 16 000 = 640
Given the statistical significance (p>0,5), the natural population does not differ from the ideal one. This means that the genetic STRUCTURE OF THE studied fox population remains undisturbed, allowing for further harvesting.
The Hardy-Weinberg law makes it possible to calculate the frequencies of certain genes and genotypes even when not all genotypes in a sample can be identified due to the dominance of specific alleles.
Example. In a certain isolated human population, the frequency of albinos (aa) is 0.0001; the genotypes of normally pigmented individuals are AA and Aa. According to the Hardy-Weinberg law, the frequency of the aa homozygotes equals q2. In our example, q2 = 0.0001, from which q = √0.0001 = 0.01; since p = 1 - q, then p = 1.00 - 0.01 = 0.99. The frequencies of normally pigmented individuals are p2 = 0.992 = 0.98 for the AA genotype and 2pq = 2 * 0.99 * 0.01 = 0.0198 for the Aa genotype.
Additionally, based on the phenotype frequencies of the heterogametic sex, one can calculate the frequency of all allelic genes and genotypes within a population.
Example. If a recessive gene is X-linked, knowing the frequency of a hereditary disease among males makes it possible to calculate the number of heterozygous females.
The frequency of the sex-linked gene determining color blindness in males is 0.08. This means that the frequency of the recessive allele (q) in the population is 0.08.
The frequency of the dominant (A) allele p = 1 - q = 1 - 0.08 = 0.92. The proportion of heterozygotes in our case is 2pq = 2 * 0.92 * 0.08 = 0.147. Knowing the frequencies of allelic genes, it is easy to calculate genotype frequencies in a population using the Hardy-Weinberg formula.
Last update: 07/08/2026
Editorial and Educational Adaptation: This material has been compiled based on the primary/original source text. The project team performed an editorial review, corrected technical inaccuracies, structured sections, and adapted the content for an educational format.
What was processed:
- elimination of formatting defects (OCR errors, structural breaks, corrupted characters);
- editorial organization of content;
- standardization of terminology in accordance with academic sources;
- verification of factual statements against the original source text.
All mentions of the author, publication year, and origin of the primary text have been preserved in accordance with the source.