BOTANY WITH BASICS OF HYDROBOTANY (AQUATIC PLANTS OF UKRAINE) - B.Ye. Yakubenko - 2011
XIV. INSTRUMENTATION AND METHODS FOR INVESTIGATING AQUATIC VEGETATION
Methods for determining the characteristics of main macrophyte communities in aquatic ecosystems [60]
Methods for phytoplankton sampling and sample processing. Sampling.
Obtaining representative data to assess the structural and Functional Characteristics of phytoplankton and their dynamics requires decadal sampling. It is important that sampling is carried out at a strictly set time, with the interval from 10:00 AM to 12:00 PM being the most optimal.
To account for the vertical dynamics of Algae and minimize errors caused by their migration through the Water Column, samples should be collected every meter of the water depth, starting from the surface horizon. The collected samples are pooled into a single container (typically a 10.0–12.0 dm polyethylene bucket), from which integrated samples (0.5–1.0 dm ) are subsequently taken. The volume of the integrated sample, 0.5 or 1.0 dm , is determined by a preliminary visual assessment of phytoplankton development: a) in the case of intensive development of planktonic algae, especially during water "blooming", an algological aliquot with a volume of 0.5 dm is sufficient; b) in the case of insignificant algae vegetation, usually during the winter, early spring, or late autumn periods, it is necessary to take 1.0 dm .
One sample is fixed, while the other is used to study living algae. Performing these Procedures is extremely urgent because fixation may damage certain morphological structures of algal Cells (flagella, various appendages, etc.), which serve as characteristic diagnostic features, especially in Volvocales, Cryptophyta, Euglenophyta, and Chrysophyta. Phytoplankton samples for quantitative estimation are collected using a water sampler. Ruttner's water sampler is the most widely used. A detailed description of this and other sampler designs can be given in the monograph by I.A. Kiselev [39]. Given that hydrochemical, microbiological, and toxicological samples are typically collected alongside phytoplankton studies, a sampler volume of 35 dm is the most appropriate. At shallow stations where depths do not exceed 2.0 m, sampling from a single horizon (typically 0.2–0.3 m) is feasible. Phytoplankton samples are collected and stored in Glass bottles or polyethylene flasks calibrated to 0.5 and 1.0 dm and tightly capped. Back in the laboratory, the glassware and containers are thoroughly washed using detergents (for polyethylene flasks) or chromic mixture (for glass bottles). Before filling, the clean glassware must be rinsed 2–3 times with 100–200 ml of the collected sample.
All bottles (flasks) must be labeled. Several options are possible:
a) digital numbering is applied to the container using oil or enamel paint;
b) medical adhesive tape is attached to the container, on which appropriate notes are made with a pencil or ballpoint pen; c) prior to sampling, the inscription is made directly on the container using a glass-marking pencil. The label on the sample flask is filled out right at the sampling station. Separately, in the mandatory data record card (field diary), researchers write down all necessary sampling details: the name of the water body, station number, its coordinates on the water body and corresponding geographical reference points, sampling date (day, month, year, time of day), water transparency, sample volume, water and air Temperature, dissolved oxygen content, hydrometeorological weather data, presence or absence of surface signs of "blooming" caused by mass algae development, petroleum product films, debris, and visually noted sources of wastewater discharge into the water body or garbage dumps within the protection Zones of the studied water body.
Sample preservation. Formaldehyde is the most common preservative. For conservation, 40% formaldehyde is added to water samples at a ratio of 1:100, the bottle is tightly capped and placed in a dark box. Despite the simplicity and accessibility of this method, the action of formaldehyde as a "harsh" fixative for algal cells can lead to their deformation, loss of flagella, shedding of protective loricae by monad forms (Euglenophytes, Dinophytes, Chrysophytes), and potentially Cell lysis in green chlorococcoid algae. In fact, up to 20–25% of the initial amount of algae is destroyed under METABOLISM/18.html">The Influence of formaldehyde within 3–5 months. At the same time, fixation with formaldehyde does not affect the MORPHOLOGICAL Structure OF diatoms and cyanobacteria. This is explained by the fact that the former possess a siliceous frustule, while the Cells of the latter are enveloped in mucus.
Lugol's solution is a "softer" fixative that does not disrupt the morphological structure of algae, but it does not always "kill" aquatic microflora and aquatic Fungi. As a result, 1–2 months later, the preserved sample begins to "spoil" and cellular structures are practically destroyed.
Ethyl alcohol is also a "softer" fixative. Rectified ethyl alcohol is used and added to the sample at a 1:10 ratio. Phytoplankton samples fixed with alcohol cannot be stored for more than 1–1.5 months; subsequently, unworked samples begin to decompose.
A combination of chromium alum solution and formaldehyde solution optimally preserves the morphological structure of planktonic algae and ensures the long-term storage of algological samples regardless of the taxonomic COMPOSITION OF THE phytoplankton.
Sample concentration. All existing Methods for sample concentration are based on one of three physical processes: sedimentation, centrifugation, or filtration through microporous filters.
Sedimentation method. Bottles (flasks) with algological samples are carefully placed in a dark, cool place without agitation. After 10–12 days, the water above the settled algae is siphoned off using a special siphon, leaving a 5–8 cm water layer above the sediment. The remaining sample (with a volume of no more than 100 ml) is transferred to a smaller container, allowed to settle for 5–7 days, and siphoned again, reducing the final volume to 10 cm . The samples are transferred to penicillin vials, 2–3 drops of formaldehyde or Lugol's solution are added, and laboratory Processing begins.
Centrifugation method. This is the fastest method for concentrating algological samples. For sufficient phytoplankton sedimentation, the centrifuge speed must be at least 1500–3000 rpm. However, under these conditions, a significant loss of various algal taxa is possible due to sediment resuspension and during transfer to the counting chamber.
Filtration method. A portable and rapid method for concentrating algological samples (up to 200 times the original sample volume) is filtration through finely porous filters. The simplicity of the hardware setup—a 1.0–2.0 dm Bunsen flask, filtration funnel, fine-pore filters, vacuum rubber tubing, and a vacuum pump creating a vacuum of up to 0.5–3.0 atm—allows this method to be used in field expeditions. A variation of vacuum filtration is pressure filtration. The disadvantage of both methods is the loss of nanoplanktonic algal species during filtration and potential damage to their morphological structures, which serve as key diagnostic features.
Laboratory sample processing. In hydrological research, light microscopes as well as scanning and transmission electron microscopes of various domestic and foreign brands are used to process algological samples. The main requirement for a Microscope is its magnification power. To obtain representative results, the eyepiece magnification must be at least K5x, and the objective magnification at least x20.
Algal Abundance is counted in special counting chambers. The Nageotte chamber with a volume of 0.01–0.05 cm is the most common in algological studies. The Use of other chambers, such as the Goryaev counting chamber designed for Blood cell counts, is undesirable because large planktonic algae, especially colonial forms, do not fit on the chamber floor. When using the Goryaev chamber, the obtained results are significantly underestimated.
Determining plant species abundance and biomass. To assess quantitative phytoplankton diversity, its abundance and biomass are calculated.
Phytoplankton abundance is calculated per 1 dm (1 L) of water using the formula:
Class="center">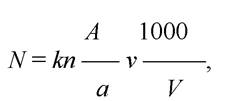
where N is the number of algae in 1 dm of water in the studied water body (typically thousand cells/dm3 or million cells/dm3 ); k is the coefficient showing how many times the volume of the used chamber is smaller than 1 cm ; n is the number of algal cells in the examined strips (squares) of the counting chamber; A is the total number of strips (squares) in the counting chamber; a is the number of strips (squares) where algae were counted; V is the volume of the phytoplankton sample taken from the water body, cm3 ; V is the volume of the concentrated sample used to calculate phytoplankton metrics, cm .
Phytoplankton biomass is determined by the volumetric calculation method. Its application requires data on the abundance of a specific algal species in the sample and the linear dimensions of its cells. To determine algal dimensions, they are equated to geometric shapes most similar to their morphological form: sphere, parallelepiped, cylinder, cone, octahedron, etc. Next, the necessary parameters are measured: radius, diameter, height, length, etc. To obtain representative data, it is necessary to measure parameters for at least 30 algal cells of the same species. The obtained data are statistically processed [9a].
Cell volume is determined using known geometric formulas based on the linear dimensions of a specific alga that resembles a certain geometric shape. It is assumed that the relative density (compared to water) of freshwater algae is 1.00–1.05. The calculated biomass of individuals of each species is multiplied by its abundance and expressed in mg/dm3, g/m3, or g/m2.
Last update: 07/08/2026
Editorial and Educational Adaptation: This material has been compiled based on the primary/original source text. The project team performed an editorial review, corrected technical inaccuracies, structured sections, and adapted the content for an educational format.
What was processed:
- elimination of formatting defects (OCR errors, structural breaks, corrupted characters);
- editorial organization of content;
- standardization of terminology in accordance with academic sources;
- verification of factual statements against the original source text.
All mentions of the author, publication year, and origin of the primary text have been preserved in accordance with the source.