PLANT BIOPHYSICS - Y. I. Posudin - 2004
II. TRANSPORT PROCESSES IN THE SOIL-PLANT-ATMOSPHERE SYSTEM
7. GAS TRANSPORT
7.3. MEASUREMENT OF CO2 ASSIMILATION
Class="center">7.3.1. Infrared gas analyzers
The operating principle of an infrared gas analyzer is based on the ability of asymmetric molecules (such as СО2) to absorb infrared radiation at specific wavelengths. The main absorption bands of СО2 are located in the regions of 4.25 µm, 2.66 µm, 2.77 µm, and 14.99 µm. Gas absorption of radiation at a wavelength l is described by the Beer-Lambert law:
where C is the molar concentration of СО2, l is the optical path length, and kλ is the molar absorption coefficient at wavelength λ.
Infrared gas analyzers are characterized by high measurement accuracy, simplicity, and reliability. Modern IRGAs feature a resolution of 0.1-1.0 µmol·mol-1 when determining СО2 exchange over a 10 cm2 leaf surface area (it is known that the atmospheric СО2 level is 340 µmol·mol-1) [Long and Hallgren, 1986; Instrumentation..., 1986; Field and Mooney, 1990].
The design of modern IRGAs consists of an infrared radiation source, a gas cuvette, and a detector. The layout of a single-beam IRGA is shown in Fig. 7.5. The infrared radiation source is made of a spiral-shaped nichrome or tungsten wire heated to 600-800 °C. The gas stream being analyzed is passed through a cuvette (whose typical length is 250 mm when a resolution of about 1 µmol·mol-1 is required). Infrared radiation at the cuvette exit passes through a filter (4.25 µm) and is fed to a detector made of a material transparent in the infrared region of the spectrum, such as calcium fluoride. In a dual-beam system, the source radiation is split into two streams—a measurement (sample) stream and a reference stream—which pass in parallel through two cuvettes (Fig. 7.6) or sequentially through them (Fig. 7.7). When these streams are equal, the system is in equilibrium. If the gas concentration in the measurement cuvette changes, the equilibrium is disrupted, and the resulting imbalance signal is amplified and recorded. The dual-beam system can eliminate variations in radiation source intensity caused by Aging or power supply voltage fluctuations.
Fig. 7.5. Schematic diagram of a single-beam infrared gas analyzer: 1 - infrared radiation source, 2 - cuvette, 3 - filter, 4 - detector, 5 - amplifier, 6 - recording system.
Fig. 7.6. Dual-beam gas analyzer setup: the source radiation is divided into two streams—measurement and reference—passing in parallel through two cuvettes: 1 - gas stream inlet, 2 - gas stream outlet, 3 - recording system, 4 - modulator, 5 - cuvette with the gas being analyzed, 6 - Diaphragm, 7 - absorption chamber, 8 - optical filters, 9 - reference cuvette, 10 - infrared radiation sources, 11 - amplifier, 12 - meter.
Fig. 7.7. Dual-beam gas analyzer setup: the source radiation is divided into two streams—measurement and reference—passing sequentially through two cuvettes: 1 - motor, 2 - infrared radiation source, 3 - modulator, 4 - reference section of the cuvette, 5 - measuring section of the cuvette, 6 - front absorption volume, 7 - pressure compensation capillary, 8 - capacitive diaphragm, 9 - detector, 10 - rear absorption volume, 11 - amplifier, 12 - measuring instrument.
Measuring systems. Most Methods for measuring CO2 exchange involve placing a sample (a leaf or an entire plant) inside a transparent chamber. The rate of CO2 assimilation is estimated from The change in carbon dioxide concentration within the chamber as an airstream passes through it. Chamber-based measurement systems are divided into three groups: closed, semi-closed, and open.
A closed system consists of a sample chamber from which air is pumped into an infrared gas analyzer (IRGA) that continuously measures the СО2 concentration (Fig. 7.8). The air stream circulates in a closed loop comprising the chamber, the analyzer, and a pump. Due to the photosynthetic activity of the sample, the CO2 concentration in the chamber decreases. The assimilation rate A is defined as the change in The amount of CO2 in the system per unit time, expressed by the equation:
where C1 and C2 are the molar fractions of СО2 (µmol·mol-1) in the system at times t1 and t2, respectively, V is the total volume of the system (mL), S is the leaf surface area (m2), and 22.4 mL is the volume occupied by 1 mmol of СО2 under standard conditions (p = 101.325 kPa, T = 273.15 K).
Fig. 7.8. Closed gas analysis system: 1 - sample chamber, 2 - infrared gas analyzer (IRGA), 3 - cuvette, 4 - pump, 5 - desiccant.
The advantages of this method are measurement simplicity and The ability to use large samples; the disadvantage is the inability to maintain constant conditions inside the chamber. Specifically, the progressive increase in humidity resulting from air recirculation within the system leads to the Condensation of liquid Water, which interacts with СО2 and distorts the measurement results.
A semi-closed system incorporates an infrared gas analyzer used as a zero-balance instrument to compare the flux of СО2 entering the system with the flux absorbed by the leaf (Fig. 7.9). The advantage of a semi-closed system is the ability to maintain a constant CO2 flux via an electronic feedback system that supplies gas to the system at a constant rate. Disadvantages include the high cost of the system (since only a single chamber can be coupled with the IRGA) and its inertia, meaning the system does not respond rapidly to prompt changes in assimilation.
Fig. 7.9. Semi-closed gas analysis system: 1 - chamber containing the sample, 2 - infrared gas analyzer (IRGA), 3 - cuvette, 4 - pump, 5 - desiccant, 6 - compressed gas cylinder, 7 - gas flow meter.
An open system differs in that an infrared gas analyzer is used to evaluate the molar fraction of CO2 at the inlet (Cin) and outlet (Cout) of the chamber (Fig. 7.10). The assimilation rate A is determined by the following expression:

where f is the molar flow of CO2 in the system (μmol·s-1).

Fig. 7.10. An open system allowing The regulation of CO2, O2, and water vapor concentrations around the leaf: 1 - pump, 2 - conditioner, 3 - gas flow regulators, 4 - chambers, 5 - selector, 6 - hygrometer, 7 - gas analyzer, 8 - recording system.
The open system allows for the regulation of CO2, O2, and water vapor concentrations around the leaf; thanks to the humidity sensor, the rates of Transpiration and CO2 assimilation can be measured simultaneously in multiple chambers.
Simultaneous measurements of transpiration and CO2 assimilation. The setup for the simultaneous evaluation of transpiration and CO2 assimilation is a chamber housing a plant. The chamber is equipped with systems for controlling illumination, Temperature, humidity, and airflow. The CO2 concentration is determined using an infrared gas analyzer, while the transpiration rate is evaluated by measuring the amount of condensed moisture collected in a burette (Fig. 7.11).

Fig. 7.11. Infrared gas analyzer for measuring CO2 concentration and estimating the transpiration rate: Б - fan, Н - hygrometer, Т - thermometer, СО2 - gas supply system, К - burette for determining the amount of condensed moisture.
7.3.2. Mass Spectrometry
THE PRINCIPLE OF mass spectrometry was discussed in the chapter "MEASUREMENT OF WATER and Solute Fluxes." This technique can also be used to evaluate the exchange of gases such as CO2, O2, and water vapor between plants and the atmosphere during Photosynthesis, Respiration, and transpiration. The layout of a compact dispersion mass spectrometer designed for these tasks is shown in Fig. 7.12 [Kaneko and Takalsuji, 1990]. The mass spectrometer is connected to the sample chamber by thin capillaries through which a pump supplies air. Due to the action of electric and magnetic fields, ion beams are separated in space according to their masses. Precise gas analysis is performed at a constant temperature of 80 °C. The Use of an accelerating electric potential of 850 V and a magnetic field with an induction of 0.48 T yields radii of curvature for ion trajectories of about 31–50 mm depending on their mass. A typical gas spectrum obtained using a compact mass spectrometer is presented in Fig. 7.13. The advantage of this method is the possibility of simultaneous and continuous measurement of CO2, O2, and water vapor; furthermore, certain gases can be labeled with stable isotopes 13C, 18O; because the system requires a small amount of gases, it is capable of measuring changes in gas concentrations over small areas (e.g., leaf segments).

Fig. 7.12. Schematic diagram of a compact dispersion mass spectrometer.

Fig. 7.13. Typical gas spectrum obtained using a compact mass spectrometer.
7.3.3. Use of Isotopes
Isotopes are variants of a given chemical element that have the same nuclear electrical charge but differ in nuclear mass; isotopes have identical nuclear charges but differ in the number of neutrons. Isotopes belonging to radioactive elements are called radioisotopes. A characteristic feature of radioisotopes is their instability; they emit energy in the form of gamma radiation (e.g., 11C) or beta radiation (such as 14C). The stability of isotopes is determined by a parameter called the half-life—the time interval during which half of the radioactive nuclei of an element decay. Thus, the half-lives of carbon isotopes are: 19.3 s for 10C; 20.3 min for 11C; 5,715 years for 14C; 2.45 s for 15C.
Radioisotopes are widely used in biophysical plant research. The 14C isotope is used to study carbohydrate transport in vivo because the radiation from this isotope can be detected with a Geiger counter. Carbon dioxide labeled with the 14C isotope is widely used to study plant carbon METABOLISM and measure the rate of CO2 assimilation. During measurements, the leaf is exposed to 14CO2 for a specific time interval (less than 60 s). After removing the plant tissue, the amount of 14C is determined, which is proportional to the rate of CO2 assimilation. A diagram of the system for using stable isotopes is shown in Fig. 7.14. A gas mixture of 14CO2 and 12CO2 contained in an aluminum cylinder is fed into the chamber with the sample for a precisely measured time interval. Afterward, the sample is quenched by immersing it in liquid nitrogen. The rate of leaf CO2 assimilation depends on leaf area and time interval, and is proportional to the count rate recorded by an ionization counter. The stable isotopes 12C and 13C do not emit radiation; the identification of stable isotopes can be accomplished using mass spectrometry or nuclear magnetic Resonance techniques.

Fig. 7.14. Diagram of the stable isotope system: 1 - aluminum container containing a mixture of 14CO2 and 12CO2, 2 - gas flow regulator, 3 - flow meter, 4 - valve, 5 - leaf chamber, 6 - soda lime Column.
The advantage of devices based on radioisotopes is their compactness and low cost compared to IRGA. By treating the sample with liquid nitrogen, the leaf can be sectioned and the distribution of the CO2 assimilation rate evaluated across the entire leaf area. Disadvantages include the destructive Nature of the measurement and potential inaccuracy due to naturally occurring isotopes in the leaves.
7.3.4. Opto-Acoustic Method
The method of opto-acoustic spectroscopy is based on The conversion of absorbed radiation into sound vibrations. The measurement Procedure consists of modulating optical radiation directed onto a sample (a leaf) placed in a chamber with a transparent window. The modulated radiation is partially absorbed by the sample and partially converted into heat, which dissipates into the surrounding space. Moreover, thermal radiation changes at the modulation frequency. If gas is present in the chamber, the gas pressure will also change at the same frequency, thus generating acoustic vibrations. Pressure changes can be detected using a microphone. A diagram of the opto-acoustic spectrometer is shown in Fig. 7.15 [Sheeny, 1985]. Thus, gas concentration, gas pressure changes, and the level of acoustic vibrations are closely interrelated. This technique can be applied to solid and opaque samples. By varying the frequency of the optical radiation delivered to the sample, an opto-acoustic spectrum of the latter can be obtained. A typical opto-acoustic leaf spectrum is presented in Fig. 7.16. Clearly, if the gas regime near the leaf surface changes As a result of transpiration or assimilation processes, this will induce pressure changes and corresponding alterations in the opto-acoustic spectrum.
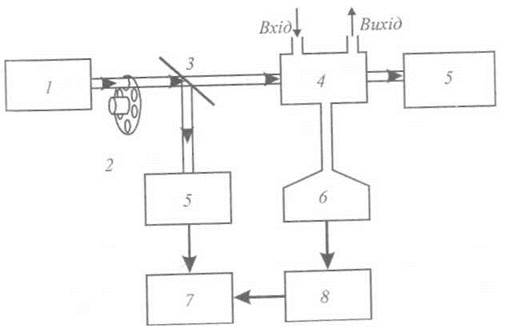
Fig. 7.15. Diagram of an optoacoustic spectrometer: 1 - laser, 2 - modulator, 3 - beam splitter, 4 - chamber, 5 - detector, 6 - microphone, 7 - amplifier, 8 - lock-in detector.
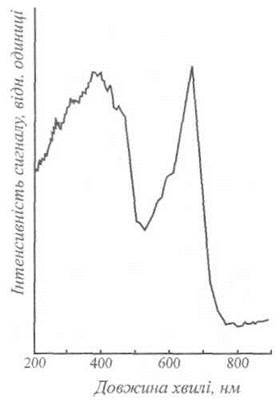
Fig. 7.16. Typical optoacoustic spectrum of a leaf.
Last update: 07/08/2026
Editorial and Educational Adaptation: This material has been compiled based on the primary/original source text. The project team performed an editorial review, corrected technical inaccuracies, structured sections, and adapted the content for an educational format.
What was processed:
- elimination of formatting defects (OCR errors, structural breaks, corrupted characters);
- editorial organization of content;
- standardization of terminology in accordance with academic sources;
- verification of factual statements against the original source text.
All mentions of the author, publication year, and origin of the primary text have been preserved in accordance with the source.