BIOLOGY Volume 2 - A Guide to General Biology - 2004
13. TRANSPORT IN PLANTS
13.3. Transpiration and Water Movement Through Leaves
13.3.7. Effect of Plant Characteristics (Internal Factors) on the Rate of Transpiration
We have already discussed how certain xeromorphic adaptations affect The rate of Transpiration. Below are a few more Examples of how endogenous, i.e., internal, non-environmental factors exert this influence.
Transpiring Surface Area and The ratio of This Surface Area to Plant Volume
Transpiration increases as the total surface area of the plant's leaves and the ratio of this surface area to its volume increase. Leaf surface area is reduced when leaves become scale-like or needle-like, as in conifers, or when they are reduced to spines1, as in cacti. Microphylly, characteristic of xerophytes, leads to the same result. Shedding leaves during dry or cold seasons is also a xeromorphic adaptation. In the latter case, this is important because soil Water freezes and becomes unavailable to the plant.
The ratio of transpiring surface area to plant volume decreases when the stem becomes the main photosynthetic organ, as in cacti. Fig. 13.12 shows examples of the characteristic reduction of leaf surface area in cacti and other succulents.
Class="center">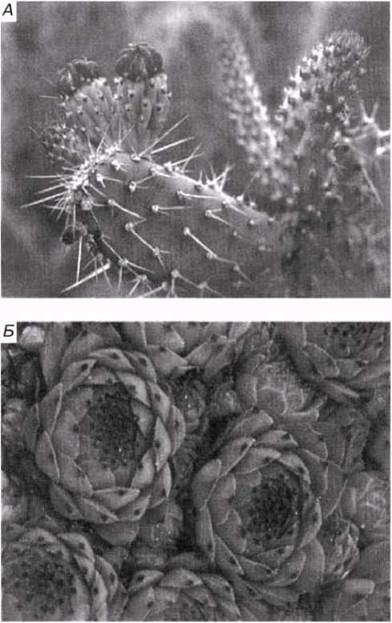
Fig. 13.12. A. In the cactus Opuntia, thick, fleshy stems serve for water storage. Since Opuntia lacks leaves, the rate of transpiration is greatly reduced, while spines protect the plant from herbivores. B. Houseleek (Sempervivum) is a typical succulent that stores water in its fleshy leaves.
Cuticle
The cuticle is a structureless layer secreted by and covering the epidermis. It consists mainly of a wax-like substance called cutin, which is impermeable to water and gases. Its partial permeability to them overall is attributed to other components. Generally, the thicker the cuticle, the lower the rate of cuticular transpiration. If the cuticle is thin, as in some ferns, the plant may lose 30–45% of its water through it.
The upper surface of dicotyledonous leaves, which is exposed to direct sunlight and usually subjected to stronger wind action than the lower surface, is often covered with a thicker cuticle layer. The wax-like components of this layer (including plant wax proper) can practically halt cuticular transpiration altogether. In addition, leaves with a thick cuticle are usually smooth and glossy, meaning they reflect more solar radiation and heat up less.
As a rule, the greater the number of stomata per unit area, the higher the rate of stomatal transpiration. However, their distribution is also important. For instance, the lower surface of dicot leaves usually has more stomata than the upper surface, whereas in monocots, whose leaves often grow at a significant angle to the horizontal, this trend is not observed (Table 13.7). On average, xerophytes have fewer stomata per unit area than mesophytes, and within the same species, their number may decrease as an adaptation to arid conditions.
Table 13.7. Stomatal distribution density on the leaves of various plants. (After Weier T.E., Stocking C.R., Barbour M.G. (1970) Botany, an Introduction to Plant Biology, 4th ed., John Wiley & Sons, p. 192.)
Plant |
Number of stomata per 1 cm2 |
|
Upper epidermis |
Lower epidermis |
|
Monocots |
||
Corn (Zea mays) |
5200 |
6800 |
Oat (Avena sativa) |
2500 |
2300 |
Dicots |
||
Apple (Malus spp.) |
0 |
29 400 |
Common bean (Phaseolus vulgaris |
4000 |
28 100 |
Cabbage (Brassica spp.) |
14100 |
22 600 |
Alfalfa (Medicago sativa |
16 900 |
13 800 |
Watercress (Nasturtium spp.) |
0 |
13 000 |
Oak (Quercus spp.) |
0 |
45 000 |
Potato (Solanum tuberosum) |
5100 |
16 100 |
Tomato (Lycopersicon esculentum) |
1200 |
13 000 |
Experiment 13.5. Studying Stomatal Distribution
Materials and Equipment
Clear nail polish
Glass slides and coverslips
Fine forceps
Fresh, fully expanded leaves
To study the distribution of stomata, it is convenient to use leaf surface impressions (peels). For this purpose, apply a thin layer of nail polish to the leaf using the brush attached to the bottle cap. Let the polish dry and carefully peel off the resulting film with forceps, place it on a microscope slide, and cover with a coverslip (you can do this in a drop of water). Examine the preparation under a microscope. Count the number of stomata in the field of view; do this several times in different areas and calculate the average. Determine the area of the microscope field of view by measuring its diameter with a transparent ruler or a calibrated microscope slide, using the formula пr2 (where r is the radius and п = 3.142). You can now calculate the number of stomata per 1 cm2.
Compare the stomatal density on the upper and lower epidermis of the same leaf and across different plant species. Is there a correlation between this density and the typical growing conditions of the species?
13.14. What relationship exists among the three variables presented in Fig. 13.13; explain it.
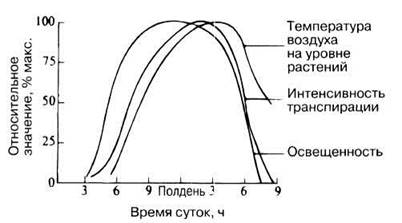
Fig. 13.13. Dependence of transpiration rate in alfalfa on light intensity and air Temperature. (From L. J. Briggs, H. L. Shantz (1916) J. Agr. Res., 5, 583–649; quoted in A. C. Leopold (1964) Plant GROWTH AND DEVELOPMENT, p. 396. McGraw-Hill.)
1 Strictly speaking, typical spines in cacti are derived not from the leaves themselves, but from bud scales. — Transl. note.
Last update: 06/08/2026
Editorial and Educational Adaptation: This material has been compiled based on the primary/original source text. The project team performed an editorial review, corrected technical inaccuracies, structured sections, and adapted the content for an educational format.
What was processed:
- elimination of formatting defects (OCR errors, structural breaks, corrupted characters);
- editorial organization of content;
- standardization of terminology in accordance with academic sources;
- verification of factual statements against the original source text.
All mentions of the author, publication year, and origin of the primary text have been preserved in accordance with the source.