GENERAL MICROBIOLOGY - T.P. Pyrog - 2004
11. BASIC MECHANISMS OF METABOLISM AND ENERGY TRANSFORMATION IN MICROORGANISMS
11.6. THE RESPIRATORY CHAIN AND PHOSPHORYLATION (ATP SYNTHESIS) DURING ELECTRON TRANSPORT
11.6.2. Redox potential
Hydrogen transport and electron transport are equivalent processes. The Respiratory Chain can be viewed as an Electron Transport Chain. The Components of the respiratory chain alternate between oxidized and reduced states and vice versa, thus acting as typical redox systems characterized by a specific redox potential.
The redox potential is a quantitative measure of the tendency of chemical compounds or elements to donate electrons. This potential is calculated relative to the molecular hydrogen potential. The hydrogen half-element—a platinized or platinum electrode immersed in an acid solution in equilibrium with gaseous molecular hydrogen at 1 atm pressure and pH 0—has a potential equal to zero (Е0 = 0).
The dependence of the redox potential on the concentration of system components is expressed by the Nernst equation:
Class="center">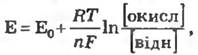
where R is the gas constant; T is the absolute Temperature; n is the number of electrons; F is the Faraday constant.
In all reactions involving protons, the standard redox potential is referred to pH 0. However, for biological systems, it is more convenient to calculate the potential at pH 7.0, since biological processes occur at pH values close to neutral.
At pH 7.0 and a temperature of 30 ºС, the potential of the hydrogen electrode becomes -0.42 V:

The redox potential is a measure of the maximum useful work that a system can perform, i.e., a measure of The change in Free energy (∆G0) in a given reaction. Based on the difference in redox potentials between two interacting systems (ΔΕ0), the change in free energy in a given reaction can be calculated in kJ/mol:

The E01 values of individual respiratory chain components range from -0.32 V (for NADH/NAD) to +0.81 V (for O2 /1/2O2).
The redox potentials of the respiratory chain components, the potential differences between individual components, and the equivalent Free Energy Changes are listed in Table 11.3.
Table 11.3
Redox potentials of respiratory chain components, potential differences, and equivalent free energy changes
Respiratory chain components |
Е01 , V |
Potential difference, V |
∆G10, kJ/mol |
Hydrogen NAD Flavoprotein Cytochrome b Cytochrome c Cytochrome a Oxygen |
-0.42 -0.32 0.08 0.04 +0.27 +0,29 +0.81 |
0.10 0,24 0,04 0.31 0,02 0.52 |
19.3 46.4 7.7 69.8 3.8 100.4 |
Last update: 12/08/2026
Editorial and Educational Adaptation: This material has been compiled based on the primary/original source text. The project team performed an editorial review, corrected technical inaccuracies, structured sections, and adapted the content for an educational format.
What was processed:
- elimination of formatting defects (OCR errors, structural breaks, corrupted characters);
- editorial organization of content;
- standardization of terminology in accordance with academic sources;
- verification of factual statements against the original source text.
All mentions of the author, publication year, and origin of the primary text have been preserved in accordance with the source.