Protein Structure and Function: Application of Bioinformatics Methods - John Rigden 2014
Integrative servers for structure-based function prediction
ProFunc
Structure-based methods employed by ProFunc
Class="center">10.3.1.1. Fold matching
The first Structure-based method is to search a representative PDB database subset for structures sharing the same or a similar fold as the query structure. This is performed using the SSM (Secondary structure Matching) program (Krissinel and Henrick 2004). The program runs a rapid graph-matching Procedure to compare secondary structure elements of the query with those of database structures. Well-matched structures are superimposed, and their RMSD is calculated over equivalent Ca atoms, alongside a standardized significance score and the native SSM significance score known as the Q-score. ProFunc displays the ten best matches ranked by Q-score, and any or all of them can be superimposed onto the query structure using the molecular graphics program RasMol (Sayle and Milner-White 1995).
The best fold match for our example, the 2fck structure, is shown in Figure 10.5. This match is the PDB structure 1s7f, which represents the RimL N(a)-acetyltransferase from Salmonella typhimurium (Vetting et al. 2005). This protein is responsible for converting the prokaryotic ribosomal protein L12 into L7 by acetylating its N-terminal amino group. The protein forms a homodimer, and the dimer interface creates a large groove capable of binding the N-terminal helix of L12. At some distance from the substrate-binding site, the protein also binds coenzyme A (CoA).
10.3.1.2. The helix-turn-helix DNA-binding motif
The second structure-based method involves searching for any helix-turn-helix (HTH) motifs that match those extracted from DNA-binding PDB structures (Jones et al. 2003; Aravind et al. 2005). False positives are filtered out using a series of parameters based on a combination of solvent accessibility and electrostatic potential (Shanahan et al. 2004); therefore, any positive result may indicate that the protein binds DNA, although this naturally provides little novel insight into the protein's function. In our example, the 2fck structure lacks HTH motifs, as expected.
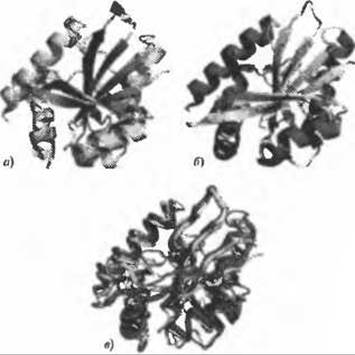
Fig. 10.5. (For the color version of this figure, see the color insert.) The fold most closely resembling the 2fck structure, identified using the SSM fold-matching program in the 1s7f structure (RimL N(a)-acetyltransferase from Salmonella typhimurium). (a) Overall 3D structure of 2fck and (b) overall structure of 1s7f in the same orientation; (c) the structures are superimposed and shown as a Ca backbone trace — 2fck in yellow and 1s7f in purple. Matching regions are highlighted with thicker lines in each structure.
10.3.1.3. Clefts
The third method identifies cleft motifs within the structure, which are frequently associated with functional sites. A cleft is an anion- or cation-binding site formed by three or more amino acid residues whose backbone dihedral angles (ψ, φ) shift between the a- and g-Regions of the Ramachandran plot, corresponding to right- and left-handed helices (Watson and Milner-White 2002a, b). As before, visualization in RasMol reveals the spatial arrangement of clefts within the context of the entire 3D structure. The ProFunc server assigns a score to each cleft based on the following criteria: the number of solvent-accessible NH atoms, the conservation of the residues comprising the cleft, and whether the cleft resides within a larger surface depression. Clefts can be particularly useful when none of the other Methods yield clues about protein function. In such cases, the locations of clefts can point to putative functionally important regions within the 3D Cell/13.html">Protein Structure.
The 2fck structure contains several such clefts, three of which receive sufficiently high scores to suggest potential functional significance. Indeed, the highest-scoring cleft is located at the probable substrate-binding site (by analogy with the similar 1s7f structure), whereas the second and third clefts are found near the entrance of the CoA-binding site.
10.3.1.4. Surface clefts and depressions
Next, all surface depressions on the protein are calculated using the SURFNET program (Laskowski 1995). These depressions are ranked by size and can be visualized using RasMol. Visualization options allow depressions to be colored according to specific properties, such as depression size, residue type, or residue conservation. Size is important because the largest depression on a protein surface typically coincides with the Location of its Active Site (Laskowski et al. 1996). Residue conservation is equally important, as a cluster of highly conserved residues, especially when located within a large pocket, strongly indicates a functional site (Lichtarge and Sowa 2002; Madabushi et al. 2002; Glaser et al. 2003). Like cleft analysis, The Study of depressions is most beneficial when other methods have failed or offer only ambiguous options. In our case, the largest depression indeed corresponds to the putative protein-binding site, matching the location of bound CoA in related structures identified via fold matching by the methods discussed above, as well as by the template methods described below.
10.3.1.5. Template Methods
The latest methods implemented in the ProFunc server involve four distinct types of residue template searches (Laskowski et al. 2005c). By definition, templates are specific spatial Conformations, typically comprising three amino acid residues. Template searching is performed using a fast spatial search algorithm called JESS (Barker and Thornton 2003), which runs in parallel across multiple processors.
Enzyme Templates
The first group consists of enzyme active site templates extracted from the manually compiled Catalytic Site Atlas (CSA) (Porter et al. 2004). Here, each template features two to five residues that are either described in literature as catalytic or are highly conserved and located in the immediate vicinity of catalytic residues. A good match (see below) with one of these templates can provide a strong indication of protein function.
Ligand and DNA Binding Templates
The next two groups comprise ligand and DNA binding templates, which are automatically generated on a weekly basis to incorporate all updates from the PDB database. Ligand templates are generated by sequentially examining each heterogroup type (According to the PDB Het Group Dictionary) and compiling a list of non-redundant PDB structures containing these heterogroups. First, residues interacting with heterogroups in each selected structure are identified. Next, templates consisting of triplets of these identified residues are defined and stored as templates for the respective heterogroups. The Selection criteria determining whether a given residue triplet qualifies as a template are as follows: each residue must be located within 5 Å of the other template residues; each template may contain no more than one hydrophobic residue (i.e., Ala, Phe, Ile, Leu, Met, Pro, or Val) to bias templates toward surface residues; and no two templates from the same structure may share more than one residue in common. Potential templates are prioritized based on their relative significance. For instance, a template containing residues that form multiple Hydrogen Bonds with a given heterogroup is more significant than one in which residues only weakly interact with the heterogroup. DNA binding templates are generated in the exact same manner, except that all DNA and RNA molecules are treated as a single unified heterogroup. As of May 2008, the database contained 584 catalytic site templates, 97,534 ligand binding templates, and 3,390 DNA binding templates. Figure 10.6 illustrates a template match between the 2fck structure and a CoA binding template in the 1s7n structure of RimL N(α)-acetyltransferase from Salmonella typhimurium.
Inverse Templates
The fourth group of templates is designed to capture any matches that might be missed by the first three groups. These are inverse templates, which are computed directly from the query structure itself. They are generated using largely the same rules as the ligand and DNA binding templates. The key differences are, first, that the entire protein structure is considered rather than only residues contacting ligands or DNA, and second, that each template is assigned a weight reflecting the conservation of its constituent residues (calculated via a Multiple Sequence Alignment using BLAST against the UniProt sequence database). Templates are selected such that, ideally, every residue in the protein is represented in at least one template, although if too many templates are generated, their number is reduced to twice the number of residues in the sequence.
The best inverse template for the 2fck structure is shown in Fig. 10.7. The match is the 1s7f structure, RimL N(α)-acetyltransferase from S. typhimurium. This is the apo-form of the 1s7n structure, which was identified as a match using the SSM secondary structure matching program and the ligand binding template described above.
Template Searching and Scoring
Template searching can yield hundreds, thousands, or even tens of thousands of matches, particularly in the case of inverse templates. Therefore, the primary challenge is to filter out random matches and retain only biologically significant ones by ranking them by significance. ProFunc accomplishes this by comparing the local environment of the template residues in its parent structure with the environment of the matching residues in the query structure. Residues in the parent structure within a 10 Å radius of the template's geometric center are paired with residues from the corresponding region of the query structure based on similarity and overlap. Where multiple pairing options exist, an optimization procedure is applied to maximize the number of identical or similar residue pairs with equivalent spatial positions. The number of residue pairs provides a rough measure of local similarity between the matching sites in the two Proteins (Figs. 10.6b and 10.7b). However, this crude metric still leaves too many false positives. Consequently, the actual scoring scheme also takes into account the relative order of the paired residues within their respective Amino acid sequences. If the paired residues appear in the same sequential order in both proteins, the probability of Sequence Homology is high.
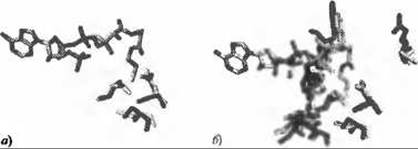
Fig. 10.6. (For color version of this figure, see the color insert.) Matching of ligand binding templates using the ProFunc server. (a) The three residues shown in purple correspond to the coenzyme A (CoA) ligand binding template, displayed in atom-type coloring (carbon gray, nitrogen blue, oxygen red, sulfur yellow, and phosphorus orange). The template is formed by residues Asn138, Ser141, and Cys134 from the PDB structure 1s7n, RimL N(α)-acetyltransferase from Salmonella typhimurium. The three residues shown in yellow are the corresponding matching residues from the query structure 2fck: Asn140, Ser143, and Cys136, respectively. The RMSD over 14 side-chain atoms is 1.18 Å. (b) Same as (a), but additionally showing matching residues located within a 10 Å radius of the template center. These are residues of the same type that superimpose when the query structure and template structure are overlaid. Purple indicates residues from the template structure (1s7n), and yellow indicates residues from the query structure (2fck).
To see why this is the case, let us consider two evolutionarily related sequences that have diverged so far that their common ancestry can no longer be detected by sequence analysis methods. However, if both have retained the same function, the region that has undergone the least change is likely to be the active site, since any alteration there would compromise the function itself. The bottom line of this reasoning is that the highest level of similarity between two proteins will be found among the residues surrounding the active site. These residues are close in space, but may be scattered across the linear sequence of the proteins. This is why structural similarity can often be detected even when it is virtually impossible to spot by comparing sequences.
An illustration of this is shown in Figure 10.7c, which presents the sequence alignment between the 2fck structure and the 1s7f structure most similar to it according to the reverse template. The alignment was defined by residues identified as equivalent in the local matching procedure described above. These residues are marked with colons between the sequences. (A single dot corresponds to residues that have lost their spatially equivalent partners in the alignment). It is easy to see that the paired residues, which lie within a compact region in space, are distributed across almost the entire length of both sequences.
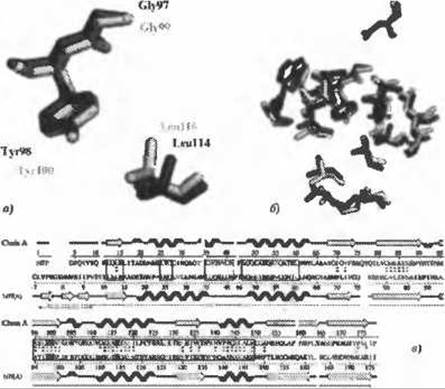
Fig. 10.7. (For the color version of this figure, see the color insert.) Reverse template match between the 2fck and 1s7f structures corresponding to the RimL N(a)-acetyltransferase from Salmonella typhimurium. a) Yellow highlights the template residues from 2fck (Gly99, Tyr100, and Leu116) that correspond to the residues from 1s7f (Gly97, Tyr98, and Leu114, respectively) shown in purple, with an RMSD of 0.62 Å over 17 matching atoms. b) Equivalent residues of the same type within a 10 Å radius from the template center. 16 such residues (out of a total of 44 within 10 Å or less) yield 36.4% local identity. The next 20 residues (not shown) are of a similar type (e.g., matching a non-Val). c) Structural alignment derived from structural superposition. The top row corresponds to the secondary structure in 2fck, and the bottom row to that in 1s7f; helices are shown as jagged elements, and ß-strands as arrows. The three highlighted residues in the sequence alignment correspond to the template residues. Double dots between the sequences denote residues located within a 10 Å sphere centered on the template center, i.e., those residues used to perform the alignment. The boxed regions represent alignment segments where sequence identity exceeds 35%. The long thin arrows at the bottom indicate structurally compatible regions, i.e., segments of both proteins where Ca atoms can be structurally superimposed with an RMSD of less than 3.0 Å.
Even more interestingly, while the overall alignment yields 24.7% sequence identity between the two proteins, 16 out of the 44 residues within a 10 Å radius of the template center are identical, giving a local identity of 36.4%. Since this region corresponds to a significant portion of the CoA-binding site in the 1s7f structure, this provides strong structural evidence that the 2fck structure also binds CoA. The region also encompasses part of the putative substrate-binding site, but it is insufficient either to conclude that both proteins share the same substrate or to imply that they have the same function.
In addition to evaluating local similarity, ProFunc employs other statistical measures. One of these is the expectation value E (E-value) associated with the score. For reverse templates, E is calculated from the distribution of all scores obtained in a given search, using the same procedure as the FASTA program (Pearson 1998). For searches using other templates, the E-value is calculated using pre-computed parameters. The best results are sorted by E-value into four categories: a highly probable match (E < 10-6), a very probable match (10-6 < E < 0.01), a probable match (0.01 < E < 0.1), and an improbable match (0.1 < E < 10.0).
Overall structural similarity and the maximum length of sequence fragments that can still be superimposed with an RMSD of 3.0 Å based on Ca atoms are also used. The latter metric can be useful when There is a long overlap, suggesting significant structural agreement even in the case of low-probability matches.
10.3.1.6. Structural Analysis Using PDBsum
While not strictly essential for function prediction, a useful side effect of submitting a structure to the ProFunc server is the generation of several pages for that structure in the PDBsum atlas. This is a richly illustrated atlas of protein structures (http://www.ebi.ac.uk/pdbsum) that performs various structural analyses for uploaded proteins and presents the results using a variety of schematic diagrams (Laskowski et al. 2005a). A couple of Examples are shown in Fig. 10.8.
Last update: 06/08/2026
Editorial and Educational Adaptation: This material has been compiled based on the primary/original source text. The project team performed an editorial review, corrected technical inaccuracies, structured sections, and adapted the content for an educational format.
What was processed:
- elimination of formatting defects (OCR errors, structural breaks, corrupted characters);
- editorial organization of content;
- standardization of terminology in accordance with academic sources;
- verification of factual statements against the original source text.
All mentions of the author, publication year, and origin of the primary text have been preserved in accordance with the source.