Protein Structure and Function. Application of Bioinformatics Methods - John Rigden 2014
Integrated servers for function prediction from structure
ProFunc
Evaluation of structural methods
How effective are structural Methods in predicting protein function? The authors of ProFunc attempted to answer this question by applying it to 92 protein structures with known Functions obtained from MCSG (Watson et al. 2007). In each case, the server's predictions were configured to exclude information from structures published after the release of the Structure under study, ensuring a more accurate assessment of what could have been predicted at that specific time.
Class="center">

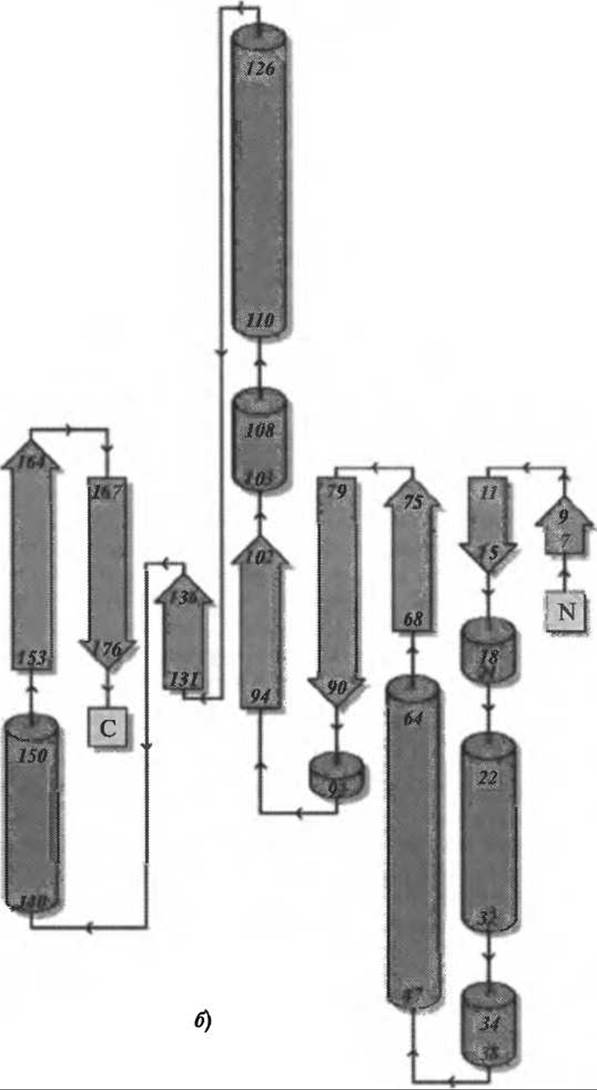
Fig. 10.8. An example of analysis from PDBsum pages, performed upon uploading any structure to the ProFunc server. a) A schematic diagram of the protein chain illustrating elements of Secondary structure (a-helices and ß-strands) along with various Structural motifs, such as ß- and y-turns and ß-hairpins. In this example, residues interacting with the bound Ligand are marked with dots above the single-letter amino acid code. In the 2fck structure, the ligands are 12 nitrate ions and a single glycerol molecule, which are of little interest or functional significance as they are simply Components of the crystallization solution. b) The topology diagram of the protein chain in 2fck. The diagram shows how ß-strands, represented by wide gray arrows, associate side-by-side to form the central ß-sheet of the domain. It also illustrates the relative spatial arrangement of a-helices, depicted here as cylinders. Small arrows indicate the direction of the protein chain from the N- to the C-terminus. Numbers adjacent to the secondary structure elements correspond to the residue numbering in the PDB file. The diagram was generated based on the results of the Procheck program (Hutchinson and Thornton 1990)
The analysis revealed that 70% of the structures would have had their function correctly described had the ProFunc server been available at the time, with three-quarters of this 70% receiving accurate predictions by more than one method.
Among the structure-based methods, the two most successful were fold comparison using the SSM program and reverse templates. The success rate for both was 50-60%. Indeed, in most cases, both methods yielded identical top results, although on one occasion one method detected a correct match where the other failed. This might suggest that, since the two methods produce such similar outcomes, all we truly need is a fold comparison method like SSM. However, being far from redundant, the reverse template method provides significantly more specific information regarding the similarity between any two structures. Moreover, it identifies regions with the highest similarity and, consequently, those most likely to serve as functional sites. In addition, the method provides compelling Evidence for the putative function by highlighting the key residues involved.
Of course, the only definitive way to validate a prediction is through experimental confirmation. This remains challenging, time-consuming, and resource-intensive, although some progress has been made in this direction with The Development of high-throughput functional assays (Yakunin et al. 2004).
Last update: 06/08/2026
Editorial and Educational Adaptation: This material has been compiled based on the primary/original source text. The project team performed an editorial review, corrected technical inaccuracies, structured sections, and adapted the content for an educational format.
What was processed:
- elimination of formatting defects (OCR errors, structural breaks, corrupted characters);
- editorial organization of content;
- standardization of terminology in accordance with academic sources;
- verification of factual statements against the original source text.
All mentions of the author, publication year, and origin of the primary text have been preserved in accordance with the source.