Principles of Protein Structure - G. Schultz 1982
Models, Depiction, and Documentation of Protein Structures
Representation of Complete Structure
Two-Dimensional Representations
Stereo Images
Stereo images are informative two-dimensional representations of a three-dimensional object. Two-dimensional structural representations are essential for publication in periodicals, and stereo images are particularly well-suited for this purpose. Typically, such stereo images consist of two adjacent drawings with their centers separated by a distance equal to the interpupillary distance (65 mm). Each drawing must be viewed accordingly, and special stereoscopic viewing devices can be used [400]. The 65 mm Separation imposes a size restriction on the drawings, limiting them to a maximum of 50 x 50 mm. Obviously, given limited printing resolution, it is not always possible to pack the required Amount of Information into such a format. The volume of readable information can be somewhat increased by printing and viewing stereo images in red and green colors. However, the mutual exclusion of red and green is usually incomplete, and color printing is costly; consequently, red-green stereo drawings are relatively rare.
Linear Images
Stereoscopic line drawings provide a clear depiction of the Structure. To illustrate chain folding in a journal article, one can prepare stereo drawings in which all Ca atoms are connected by straight lines (Fig. 4.2, a). Sometimes Ca atoms are denoted by small circles and sequence numbers. Such stereo drawings trace The amino acid chain exceptionally well, even when it consists of more than 800 residues, as in the case of phosphorylase [236].
If one were to plot not only the Ca atoms and virtual bonds between them, but also all bonds between non-hydrogen atoms, the stereo image of the entire molecule would become overly cluttered and lose its clarity. Therefore, such details are restricted to specialized illustrations of individual molecular regions. A continuously updated collection of stereo projections for various parts of all known complete protein structures is available in the AMSOM microfiche atlas [401]. Despite the high level of detail (about 103 images per molecule), the AMSOM Atlas provides only standard projections. More versatile information can be obtained by displaying the molecule on a cathode-ray tube screen. The stereoscopic effect can be achieved by splitting the screen in half or by rotating the molecule at a controlled speed [397] (Section 7.2).
Class="center">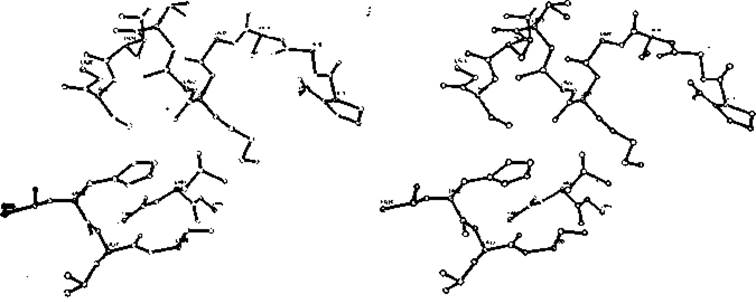
Fig. 7.5. ORTEP stereo image [324] of the adenylate kinase Active Site. Only non-hydrogen atoms are shown; Ca atoms are highlighted.
The ORTEP graphics program can be used to construct both wireframe and volumetric models. Highly elegant molecular renderings can be produced using the ORTEP program developed by Johnson [324] for small molecules. ORTEP enables accurate mono- or stereoscopic representations of Ball-and-stick models and was used to depict the Collagen structure (Fig. 5.6, a). The program is particularly useful for analyzing functional elements of protein molecules, such as the Active Site of adenylate kinase shown in Fig. 7.5. By assigning each atom a sphere corresponding to its Van der Waals radius, ORTEP generates a striking image of the molecular surface resembling a photograph of a physical space-filling model (Fig. 5.6, b). However, minor artifacts may occur at the intersections of spheres belonging to covalently bonded atoms.
Structural Diagrams
Diagrams display only the essential features of a structure. Because the volume of graphical data for a protein is vast, readers may lose interest if every detail is presented. In many cases, a general outline highlighting only the critical structural elements is entirely sufficient. This explains the widespread use of so-called structural diagrams (for the most successful Examples,
see [794]). In such diagrams, a-helices are typically represented by cylinders and ß-sheets by arrows (Fig. 7.6). To avoid gross errors, these diagrams are usually constructed after the main chain trace has been computed.
Recently, a form of "molecular striping" [235, 247, 255] has gained widespread popularity, reducing structural details entirely to ß-sheet topology. Here, the chain folding pattern is determined by the orientation and connectivity of the ß-sheets. As illustrated in Fig. 7.7, this yields a fundamentally two-dimensional representation. More detailed diagrams [235, 249] indicate a-helices at the connection points between pleated sheets (Fig. 5.17, d). Such diagrams have helped uncover several structural features, notably the prevalence of the right-handed ßaß motif (Section 5.2). Note that ß-sheet topology can be easily integrated with Amino Acid Sequence data using a simple graph representation [186].
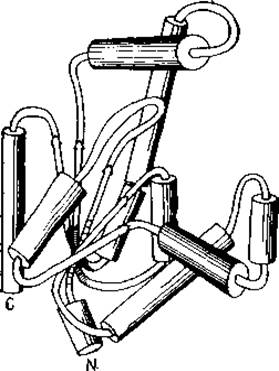
Fig. 7.6. Structural diagram of adenylate kinase. Helices are shown as cylinders, and ß-sheets as arrows.
Hydrogen Bonding Structure
Diagrams can be effectively used to present stereochemical data. In addition to General Information—such as atom designations and coordinates—comprehensive Cell/13.html">Protein Structure descriptions typically include a wealth of supplementary data regarding Hydrogen Bonds and other non-covalent interactions between backbone and side-chain atomic groups, as well as any interactions (including covalent ones) between the polypeptide chain and prosthetic groups, Cofactors, substrates, metals, other ligands, Water molecules, and so forth. Usually, these data are compiled into extensive tables from which relevant information is retrieved as needed. However, in some cases, structural diagrams similar to the one shown in Fig. 7.8 serve as a vastly superior format for presenting such chemical data.
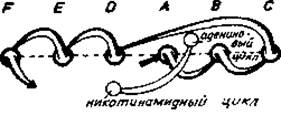
Fig. 7.7. Topology of the ß-Structure of Lactate dehydrogenase and other NAD-dependent dehydrogenases [255].
The twisted parallel ß-structure (Fig. 5.10) is omitted. Six chains (circles A-F) have their C-termini pointing toward the viewer. All connecting segments, According to the definition (Fig. 5.12, a), are right-handed.
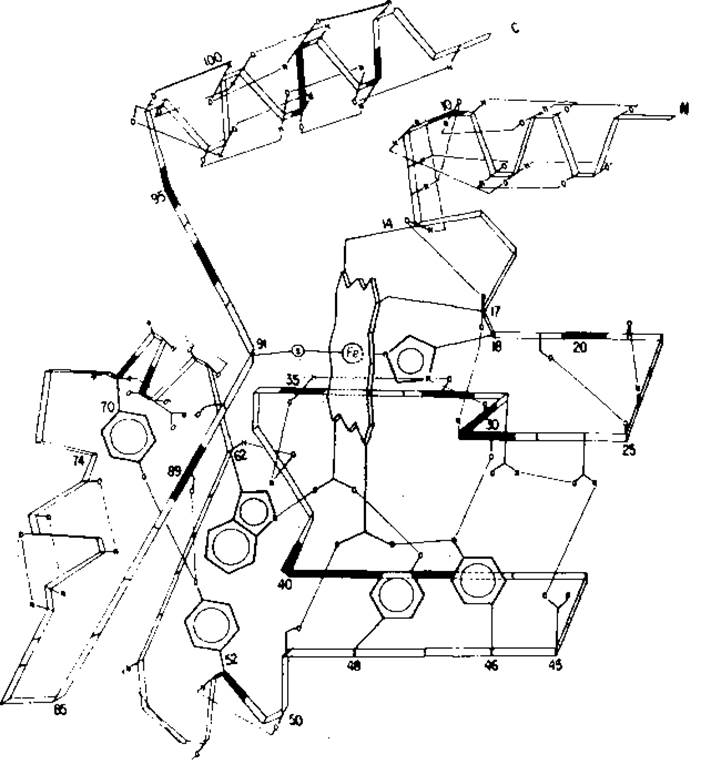
Fig. 7.8. Schematic representation of cytochrome c2 from Rhodospirillum rubrum [272] illustrating the hydrogen bonding network. Residues lining The surface of the heme pocket are blackened. The numbering scheme differs from that used by Dayhoff [145].
Last update: 06/08/2026
Editorial and Educational Adaptation: This material has been compiled based on the primary/original source text. The project team performed an editorial review, corrected technical inaccuracies, structured sections, and adapted the content for an educational format.
What was processed:
- elimination of formatting defects (OCR errors, structural breaks, corrupted characters);
- editorial organization of content;
- standardization of terminology in accordance with academic sources;
- verification of factual statements against the original source text.
All mentions of the author, publication year, and origin of the primary text have been preserved in accordance with the source.