Amino Acids, Peptides and Proteins - Dévényi T., Gergely J. 1976
Methods of Immunochemical Analysis
Protein Analysis by Gel Diffusion Methods
Oudin's Method of Simple Linear Gel Diffusion
Principle of the method. Soluble antigen diffuses into an Agar gel containing antiserum. In the region of the gel where a relative excess of antigen occurs, a precipitation band forms in the agar.
Applications. Determination of soluble protein antigen concentration. Determination of the minimum number of antigenic components detected by a given antiserum in a protein mixture.
Materials AND EQUIPMENT FOR THE ASSAY
1. Tubes 60–80 mm long and 2–3 mm in diameter.
2. Capillary (Pasteur) pipettes.
PROCEDURE
1. Agar purification. High-quality purified agar should be used for the assay. If the agar is not sufficiently pure, it is recommended to treat it as follows.
Dissolve 30.0 g of agar, typically used for preparing culture media, in 400 ml of neutral distilled Water by heating in a boiling water bath. As soon as the agar dissolves, pour the solution into a tray. After cooling, cut the solidified agar into small cubes and wash them with running tap water for 3 days, followed by neutral distilled water for the next 3 days. Change the distilled water at least twice a day. Melt the washed agar cubes again in an Erlenmeyer flask by heating in a water bath, dispense into vials, and store in a refrigerator until use.
2. Preparation of agar gel. Before using the washed agar, determine its dry matter content. To do this, weigh a Petri dish carefully, then pour 10 ml of melted agar into it. After solidification, dry the agar in an oven at 100°C for approximately 12 h. After cooling, weigh the Petri dish again and calculate the agar concentration in the washed gel. (For example, if the Petri dish weighed 50.0 g before adding 10 ml of agar, and weighs 50.5 g after drying, the added agar solution had a concentration of 5%.) Knowing this value, melt the washed agar and dilute it to the desired concentration with a 0.9% NaCl solution, adding 0.01% thimerosal as a preservative.
3. Coating the inner surface of the tubes with agar. To coat the inner surface of the tubes with a thin layer of agar, fill them with 0.1% melted agar using a capillary pipette, and immediately pour the agar out. Dry the agar films by placing the tubes in a desiccator.
4. Performing the assay. Cool 0.6% agar melted in physiological saline to 46–48°C and mix with an equal volume of antiserum heated to the same Temperature. Using a capillary pipette, introduce the melted mixture of agar and antiserum into the tubes coated internally with a dry agar film, avoiding air bubbles. The agar Column in the tube should be about 4 cm high.
Once the agar has solidified, layer the antigen solution on top using a capillary pipette to fill the tube to a height of 2–3 cm, seal with paraffin, and leave at room temperature.
NOTES
1. After a certain period, the antigen diffuses into the agar. Under conditions of relative antigen excess, a precipitation band forms in the agar, which slowly migrates from the interface between the agar and the antigen solution into the lower layers of the agar. The migration of the band is driven by antigen diffusion in the agar gel, which gradually increases the antigen concentration between the precipitation band and the upper boundary of the agar layer, i.e., above the so-called precipitation front. As the antigen concentration increases, the precipitation front not only moves downward, but the precipitate at the upper edge of the band also dissolves.
2. The distance between the precipitation front and the upper boundary of the agar layer (h) is proportional to the square ROOT of the time elapsed from the moment the antigen solution was layered to the moment the precipitation is recorded (t). This relationship allows calculating the migration rate (k) of the precipitation front According to the following equation:
Class="center">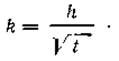
The same equation also enables the quantitative analysis of unknown antigen solutions. At a low antigen-to-antibody ratio, the antibody concentration a and antigen concentration g are related by the following equation:

where g0 and a0 are The values of g and a at 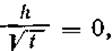 , while y and a are coefficients greater and less than zero, respectively. Thus, the migration rate of the precipitation front k is directly proportional to the logarithm of the antigen concentration g and inversely proportional to the logarithm of the antibody concentration a.
The value of k increases with temperature and decreases with increasing agar concentration. Abrupt temperature changes may cause non-specific precipitates to appear, which, however, do not migrate.
The value of h is usually expressed in mm and measured daily.
Last update: 06/08/2026
Editorial and Educational Adaptation: This material has been compiled based on the primary/original source text. The project team performed an editorial review, corrected technical inaccuracies, structured sections, and adapted the content for an educational format.
What was processed:
- elimination of formatting defects (OCR errors, structural breaks, corrupted characters);
- editorial organization of content;
- standardization of terminology in accordance with academic sources;
- verification of factual statements against the original source text.
All mentions of the author, publication year, and origin of the primary text have been preserved in accordance with the source.