BIOLOGY Volume 1 - A Guide to General Biology - 2004
8. HETEROTROPHIC NUTRITION
8.8. Recommended Nutrient Intakes and Their Standard Values
The first human nutritional guidelines were developed by the League of Nations in 1937. During the Second World War, the British government formulated a scientifically based food policy. Subsequently, the Committee on Medical Aspects of Food Policy was established.
In 1979, this Committee published tables Setting out Recommended Daily Allowances (RDAs) for energy and nutrients for specific population groups. These figures took into account age, sex, level of activity, and Pregnancy or Lactation (for women). For each group, the requirements of the majority of people were considered, including those with relatively high requirements.
8.8.1. Dietary Reference Values (DRVs)
In 1987, the Committee began reviewing the RDAs and published another report in 1991. By this time, 40 nutrients had been examined in detail, compared with the previous 10. Furthermore, it was noted that the term RDA was often misinterpreted as the recommended ideal or minimum nutrient intake for every healthy individual.
8.10. Explain why it is incorrect to interpret the term RDA as an ideal requirement for every individual?
Consequently, the term 'recommended daily allowance' was replaced by estimated average requirement (EAR), and two new terms were introduced: reference nutrient intake (RNI) and lower reference nutrient intake (LRNI). These three terms are now collectively referred to as Dietary Reference Values (DRVs). Tables 8.8 and 8.9 show daily DRVs. The meanings of these terms are explained below. Figure 8.27 illustrates the LRNI, EAR, and RNI for populations as a whole. It is assumed that requirements for energy or any specific nutrient within a population follow a normal distribution curve (a bell-shaped curve where mean values occur with maximum frequency).
Class="center">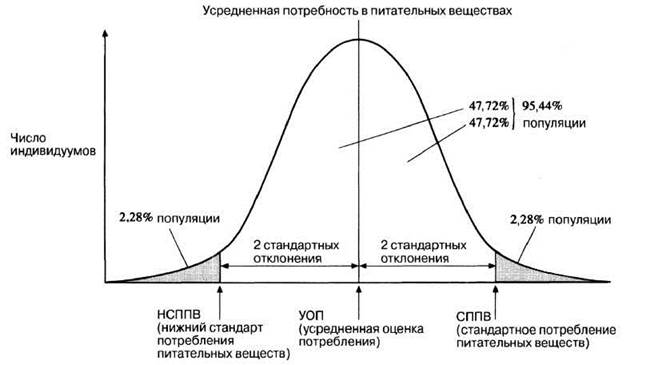
Fig. 8.27. Relationship between LRNI, EAR, and RNI in a population.
1. Estimated Average Requirement (EAR)
This value is determined for energy (Table 8.8), protein, Vitamins, and minerals. It represents the approximate average daily requirement for these dietary components. Typically, about half of the population requires more than this amount, while the other half requires less.
Table 8.8. Estimated Average Requirement (EAR) for energy for the United Kingdom (per day)
Age group |
Males |
Females |
||
MJ |
kcal |
MJ |
kcal |
|
0—3 months |
2.28 |
545 |
2.16 |
515 |
(bottle-fed) |
||||
4—6 months |
2.89 |
690 |
2.69 |
645 |
7—9 months |
3.44 |
825 |
3.20 |
765 |
10—12 months |
3.85 |
920 |
3.61 |
865 |
1—3 years |
5.15 |
1230 |
4.86 |
1165 |
4—6 years |
7.16 |
1715 |
6.46 |
1545 |
7—10 years |
8.24 |
1970 |
7.28 |
1740 |
11—14 years |
9.27 |
2220 |
7.92 |
1845 |
15—18 years |
11.51 |
2755 |
8.83 |
2110 |
19—50 years |
10.60 |
2550 |
8.10 |
1940 |
51—59 years |
10.60 |
2550 |
8.00 |
1900 |
60—64 years |
9.93 |
2380 |
7.99 |
1900 |
65—74 years |
9.71 |
2330 |
7.96 |
1900 |
75+ years |
8.77 |
2100 |
7.61 |
1810 |
Pregnancy |
+9.80* |
+200* |
||
Lactation: |
||||
1 month |
+1.90 |
+450 |
||
2 months |
+2.20 |
+530 |
||
3 months |
+2.40 |
+570 |
||
4—6 months |
+2.00 |
+480 |
||
>6 months |
+1.00 |
+240 |
||
* Last three months only. From Manual of Nutrition, Reference Book 342 (HMSO) 10th ed. (1995), table 24, p. 68. |
||||
2. Reference Nutrient Intake (RNI)
This value is determined for protein, vitamins, and minerals (Table 8.9). It replaces the outdated RDA and represents an amount of a nutrient that is enough, or more than enough, for about 97% of people in a group. If average intake within a group is at the RNI level, the risk of deficiency diseases in that group is very low. In other words, maintaining an intake at or near this level ensures good health.
Table 8.9. Reference Nutrient Intakes (RNIs); data for selected nutrients in the United Kingdom (per day)
Age group |
Protein, g |
Calcium, mg |
Iron, mg |
Zinc, mg |
Vitamin A, µg |
Thiamin, mg |
Vitamin B6a, mga |
µg |
mg |
Vitamin D, µg |
0—3 months |
12.5 |
525 |
1.7 |
4.0 |
350 |
0.2 |
0.2 |
50 |
25 |
8.5 |
(infant formula) 4—6 months |
12.7 |
525 |
4.3 |
4.0 |
350 |
0.2 |
0.2 |
50 |
25 |
8.5 |
7—9 months |
13.7 |
525 |
7.8 |
5.0 |
350 |
0.2 |
0.3 |
50 |
25 |
7 |
10—12 months |
14.9 |
525 |
7.8 |
5.0 |
350 |
0.3 |
0.4 |
50 |
25 |
7 |
1—3 years |
14.5 |
350 |
6.9 |
5.0 |
400 |
0.5 |
0.7 |
70 |
30 |
7 |
4—6 years |
19.7 |
450 |
6.1 |
6.5 |
500 |
0.7 |
0.9 |
100 |
30 |
— |
7—10 years |
28.3 |
550 |
8.7 |
7.0 |
500 |
0.7 |
1.0 |
150 |
30 |
— |
Males |
||||||||||
11—14 years |
42.1 |
1000 |
11.3 |
9.0 |
600 |
0.9 |
1.2 |
200 |
35 |
— |
15—18 years |
55.2 |
1000 |
11.3 |
9.5 |
700 |
1.1 |
1.5 |
200 |
40 |
— |
19—50 years |
55.5 |
700 |
8.7 |
9.5 |
700 |
1.0 |
1.4 |
200 |
40 |
— |
50+ years |
53.3 |
700 |
8.7 |
9.5 |
700 |
0.9 |
1.4 |
200 |
40 |
* |
Females |
||||||||||
11—14 years |
41.2 |
800 |
14.8b |
9.0 |
600 |
0.7 |
1.0 |
200 |
35 |
— |
15—18 years |
45.0 |
800 |
14.8b |
7.0 |
600 |
0.8 |
1.2 |
200 |
40 |
__ |
19—50 years |
45.0 |
700 |
14.8b |
7.0 |
600 |
0.8 |
1.2 |
200 |
40 |
— |
50 + years |
46.5 |
700 |
8.7 |
7.0 |
600 |
0.8 |
1.2 |
200 |
40 |
* |
Pregnancy +6.0 |
c |
c |
c |
+100 |
+0.1d |
c |
+100 |
+10 |
10 |
|
Lactation: 0—4 months |
+11.0 |
+550 |
c |
+6.0 |
+350 |
+0.2 |
c |
+60 |
+30 |
10 |
4 months |
+8.0 |
+550 |
c |
+2.5 |
+350 |
+0.2 |
c |
+60 |
+30 |
10 |
|
a Based on protein providing 14.7% of energy EAR. b These RNI values do not account for the needs of approximately 10% of women with high menstrual losses, who may require additional iron. c No increment. d Last three months only. * After 65 years, the RNI value is 10 µg/day for both men and women. From Manual of Nutrition, table 25, p. 69 (see Table 8.8). |
||||||||||
3. Lower Reference Nutrient Intake (LRNI)
This value is determined for protein, vitamins, and minerals. It represents The amount of a nutrient that is adequate only for the small number of individuals in a group with very low requirements. In other words, an intake below this level is inadequate for the body's needs and poses serious health risks.
Energy is excluded from the RNI and LRNI because appetite is generally closely linked to Energy Requirements, and consuming more energy than needed can lead to obesity. EAR values for energy are given in Table 8.8.
Fats and CARBOHYDRATES
The 1970 report by the Committee on Medical Aspects of Food Policy did not include RDAs for fats and carbohydrates, as THE CONTRIBUTION OF these two nutrients was accounted for within the energy RDA. However, from a health perspective, two main issues were examined: 1) the relative quantities of fats and carbohydrates in the diet; and 2) the relative proportions of saturated and unsaturated fats. The 1991 report included recommendations to assist diet planners. Table 8.10 shows energy requirements based on the average British diet at the time the report was written, alongside Dietary Reference Values. DRVs are not expressed as RNIs, LRNIs, or EARs because carbohydrates and fats, unlike Essential Fatty acids, are not strictly essential nutrients. Instead, a different indicator was used, namely the estimated average percentage of total dietary energy derived from them (averaged across Selection/30.html">The population as a whole).
Table 8.10. Fats, fatty acids, and carbohydrates in the adult British diet; intake in 1990 and DRVs
Nutrient |
Average intake |
Approximate daily |
RDIs, recommended daily |
substance |
in 1990, g/day |
energy intake, % |
energy intake (1991), % |
Total fat (glycerol + fatty acids) |
87.8 |
40 |
33 |
Fatty acids: cis-polyunsaturated |
13.3 |
6 |
6 |
cis-monounsaturated |
26.7 |
12 |
12 |
saturated |
36.5 |
16 |
10 |
trans-monounsaturated |
4.8 |
2 |
2 |
Total fatty acids |
81.3 |
36 |
30 |
Total carbohydrates Sugars |
232 |
40 |
47 |
(excluding Cell wall carbohydrates and milk) |
60 |
10 |
10 |
Starch (+ cell wall sugars and milk sugar) |
170 |
30 |
37 |
Dietary fiber |
11.6 |
11.6 g/day |
18 g/day |
Energy |
8.6 MJ/day (2061 kcal/day) |
||
Total energy (actually average) Fats and carbohydrates |
|||
(excluding dietary fiber) |
80 |
||
Protein |
15 |
||
Alcohol* |
5 |
||
Total |
100 |
||
* Alcohol is a source of energy. If alcohol is absent from the diet, all recommended values presented in the table should be slightly higher. Data expressed in g/day are adapted from Gregory J., Foster, K., Tyler H., Wiseman M. The Dietary and Nutritional Survey of British Adults, HMSO (1990). Data on sugars and starch were modified by the author for easier comparison with RDIs. |
|||
8.11. Compare the average intake in 1990 with the RDIs (Table 8.10). What are the main dietary recommendations for change?
8.12. What are two potential difficulties one might encounter when keeping an accurate food diary of an individual diet?
Note that RDIs are not recommended intake levels for individuals or specific groups. They serve as reference values that can be applied in various ways. However, we still lack sufficient data to calculate reliable RDIs.
Last update: 06/08/2026
Editorial and Educational Adaptation: This material has been compiled based on the primary/original source text. The project team performed an editorial review, corrected technical inaccuracies, structured sections, and adapted the content for an educational format.
What was processed:
- elimination of formatting defects (OCR errors, structural breaks, corrupted characters);
- editorial organization of content;
- standardization of terminology in accordance with academic sources;
- verification of factual statements against the original source text.
All mentions of the author, publication year, and origin of the primary text have been preserved in accordance with the source.