Fundamentals of Bioinformatics - Ogurtsov A.N. 2013
Foundations of Bioinformatics
Subject of Bioinformatics
Characteristics of Bioinformatics Data
Biology is traditionally regarded as a descriptive rather than analytical science. Although recent scientific breakthroughs have not altered this fundamental direction, The Nature of biological data has changed radically.
Until recently, all biological observations were largely incidental in nature—granted, with varying degrees of accuracy, and some conducted with genuinely exceptional quality.
The first defining feature of the latest generation of biological research data is that they have become not only quantitative and more precise, but also discrete, as in the case of nucleotide and Amino acid sequences.
Decoding the genomic sequence of an individual Organism or clone has become not only fully achievable but, crucially, precise. Experimental errors can never be completely ruled out, but for modern genome sequencing, they are remarkably low.
This does not mean that biology has transformed into an analytical science. While life certainly obeys the laws of physics and chemistry, it remains far too complex and dependent on a chain of historical contingencies to allow for a detailed explanation of its properties from first principles today. Moreover, the achieved precision in mapping genomes is not a sufficient condition for explaining The phenomenon of life.
The second obvious characteristic of bioinformatic data is their sheer scale. Currently, nucleotide sequence Databases contain approximately 20 billion Base Pairs. If we use the size of The Human Genome (Human Genome Equivalent, HUGE) as a unit of measurement, this volume of information is equivalent to 7 HUGE. The Cell/13.html">Protein Structure database alone contains over 86,000 entries, each providing a complete Description of the coordinates of ~400 amino acid residues for a given protein in three-dimensional space (Figure 1) - http://www.pdb.org/.
Class="center">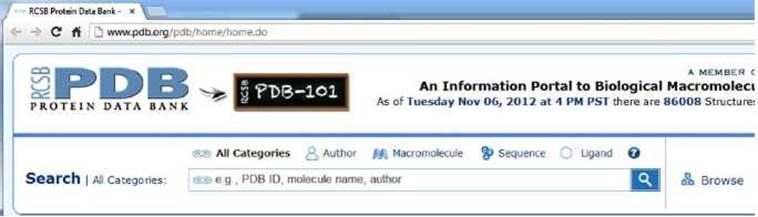
Figure 1 - Web page of the Protein Data Bank (PDB)
Not only are individual databases massive, but their growth rates are also exponential. For instance, Table 1 illustrates the growth dynamics of the GenBank genetic sequence database, http://www.ncbi.nlm.nih.gov/genbank/. These data are also presented graphically in Figure 2.
The volume and quality of such biological data drive researchers toward the following objectives:
✵ To achieve a clear and holistic view of the living world—that is, to understand the integrative aspects of organismal biology viewed as coordinated, complex systems.
✵ To bridge the sequence, three-dimensional structure, interactions, and Functions of individual Proteins, Nucleic Acids, and their complexes.
✵ To leverage data on contemporary organisms as a foundation for studying organisms across time:
- backward into the past to reconstruct The sequence of events in evolutionary history (Phylogenetic Analysis),
- forward toward the evidence-based modification of biological systems (biotechnology).
✵ To facilitate the application of this knowledge in medicine, agriculture, and other fields.
Table 1 - Growth dynamics of the GenBank database
|
Year |
Number of base pairs |
Number of sequences |
Year |
Number of base pairs |
Number of sequences |
|
1982 |
680 338 |
606 |
1996 |
651 972 984 |
1 021 211 |
|
1983 |
2 274 029 |
2 427 |
1997 |
1 160 300 687 |
1 765 847 |
|
1984 |
3 368 765 |
4 175 |
1998 |
2 008 761 784 |
2 837 897 |
|
1985 |
5 204 420 |
5 700 |
1999 |
3 841 163 011 |
4 864 570 |
|
1986 |
9 615 371 |
9 978 |
2000 |
11 101 066 288 |
10 106 023 |
|
1987 |
15 514 776 |
14 584 |
2001 |
15 849 921 438 |
14 976 310 |
|
1988 |
23 800 000 |
20 579 |
2002 |
28 507 990 166 |
22 318 883 |
|
1989 |
34 762 585 |
28 791 |
2003 |
36 553 368 485 |
30 968 418 |
|
1990 |
49 179 285 |
39 533 |
2004 |
44 575 745 176 |
40 604 319 |
|
1991 |
71 947 426 |
55 627 |
2005 |
56 037 734 462 |
52 016 762 |
|
1993 |
157 152 442 |
143 492 |
2006 |
69 019 290 705 |
64 893 747 |
|
1994 |
217 102 462 |
215 273 |
2007 |
83 874 179 730 |
80 388 382 |
|
1995 |
384 939 485 |
555 694 |
2008 |
99 116 431 942 |
98 868 465 |
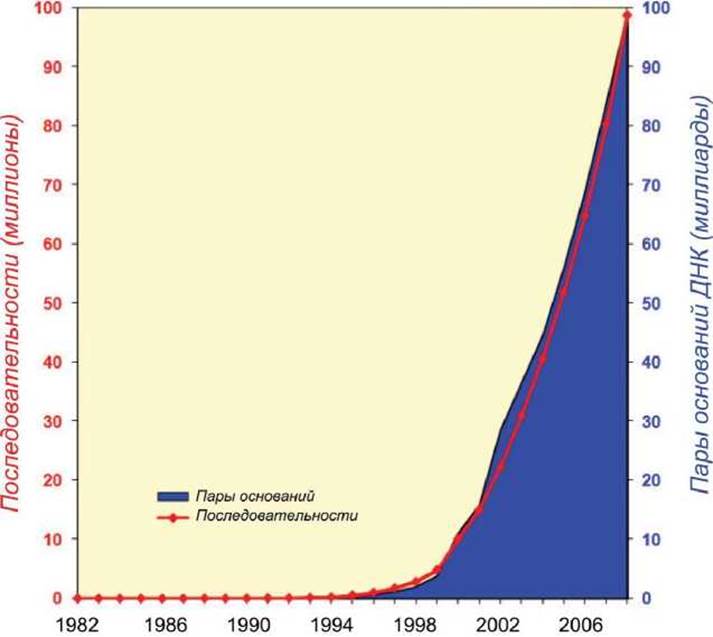
Figure 2 - Growth dynamics of the GenBank genetic sequence database http://www.ncbi.nlm.nih.gov/genbank/genbankstats-2008/
A DNA molecule consists of thousands of NUCLEOTIDES; therefore, determining the complete nucleotide sequence of an entire chromosomal DNA molecule presents a formidable challenge (see [6], p. 5). With the advent of Gene cloning technology and the Polymerase Chain Reaction (PCR), scientists gained The ability to isolate individual chromosomal DNA fragments (see [7], p. 11). These breakthroughs, in turn, paved the way for The Development of fast and efficient DNA Sequencing Methods.
In the late 1970s, two sequencing methods emerged, based on chain-termination and chemical Cleavage reactions, respectively. With minor modifications, these methods laid the groundwork for the sequencing revolution of the 1980s and 1990s and the subsequent birth of bioinformatics.
Owing to its sensitivity, Specificity, and automation potential, PCR is considered a leading method for analyzing genomic DNA samples and constructing genetic maps. Subsequent refinements to the core PCR technology have further enhanced the power and practical utility of this technique.
As early as the early 1980s, researchers manually read DNA sequences from band patterns on gel films using electronic chart recorders. In 1987, Stephen A. Krawetz developed the first software for automated reading devices Processing gel films.
Since the acquisition of the first semi-automated sequencing run in 1987, the practical Implementation of PCR in 1990, and the Introduction of fluorescent labeling for DNA fragments generated by Sanger's polymer copying method (see [7], p. 11.2), large-scale sequencing has been successfully performed, making an invaluable contribution to the development of bioinformatics. At the same time, technologies for the automated recording of sequence-sequencing results underwent significant advancement.
In the early 1990s, John Craig Venter and his colleagues developed a novel method for gene discovery. Instead of sequencing chromosomal DNA at maximum single-nucleotide resolution, Venter's group isolated mRNA molecules, reverse-transcribed them into cDNA, and then sequenced a portion of these cDNA molecules. This resulted in the creation of Expressed Sequence Tags (ESTs)—a term first coined by Anthony Kerlavage.
These EST sequences could be used as signposts (identifiers or "fingerprints") to isolate the intact gene. Furthermore, the EST approach paved the way for the establishment of massive nucleotide sequence databases, and the advancement of the EST method is widely considered to have proven the feasibility
of high-throughput gene discovery projects while providing a key impetus for the development of applied Genomics.
The 1980s marked the launch of several projects aimed at creating detailed genetic and physical maps of the human genome (Figure 3). The objective of these projects was to decipher the complete nucleotide sequence of the human genome and to map the loci (fixed chromosomal locations) of an estimated 30,000 genes. Such a monumental undertaking stimulated the development of novel computational methods for analyzing genetic maps and DNA sequencing data, while also driving the innovation of new laboratory techniques and equipment for DNA decoding and analysis.
To ensure that the wider research community could access the decoding results as rapidly as possible, it was necessary to develop advanced tools for disseminating the generated information.
The international research program that emerged from this global initiative was named the Human Genome Project (HGP). Further information on this and other genome-sequencing projects can be found at the following links:
✵ http://genomics.energy.gov/;
✵ http://oml.gov/sci/techresources/Human_Genome/publicat/tko/index.html;
✵ http://www.geneontology.org/GO.refgenome.shtml;
✵ http://www.genome.gov/.
Launched in 2007, The 1000 Genomes Project (http://www.1000genomes.org) aimed to sequence the complete genomes of 1,000 individuals, with each genome comprising 6 gigabase pairs (6 Gbp), totaling 6 terapase pairs (6 Tbp) [56]. By March 2012, the comprehensive dataset of sequenced genes exceeded 250,000 files totaling over 260 terabytes. To support this project, a Data Coordination Center (DCC) was established, and next-generation sequencing (NGS) technologies were developed [57], which ultimately reduced the cost of sequencing a single genome to US$5,000.
Figure 3 - Web pages of genome projects: a - U.S. Department of Energy Genome Program; b - To Know Ourselves; c - Genome Annotation Project; d - National Human Genome Research Institute
Last update: 11/08/2026
Editorial and Educational Adaptation: This material has been compiled based on the primary/original source text. The project team performed an editorial review, corrected technical inaccuracies, structured sections, and adapted the content for an educational format.
What was processed:
- elimination of formatting defects (OCR errors, structural breaks, corrupted characters);
- editorial organization of content;
- standardization of terminology in accordance with academic sources;
- verification of factual statements against the original source text.
All mentions of the author, publication year, and origin of the primary text have been preserved in accordance with the source.