Genetics - A. V. Sivolob 2008
Formal Genetics: Patterns of Trait Inheritance
Quantitative Traits
The preceding Structure/133.html">Discussion focused mainly on traits that are clearly expressed in the phenotype and easily distinguished from alternative variants. When segregation occurs, there is no ambiguity as to which phenotypic Class a given individual belongs. Such traits (for example, specific pigmentation patterns or structural features, the absence of a particular enzyme, etc.) are commonly referred to as qualitative traits. However, many hereditary traits cannot be described precisely in qualitative terms—for instance, when gradual, subtle transitions are observed between individuals, and segregation does not yield sharply demarcated phenotypic classes. These traits (such as body weight and dimensions, fertility, crop yield, productivity, early maturity, protein and fat content, etc.) must be studied through measurements or counts that provide numerical characterization. Such traits are termed quantitative traits. A strict boundary between Qualitative and quantitative traits cannot be drawn: some quantitative traits can be described qualitatively (e.g., tall vs. dwarf, early-maturing vs. late-maturing), while qualitative differences can be expressed quantitatively (e.g., color differences expressed by The amount of pigment). Nevertheless, qualitative descriptions are possible only in rare cases where these differences are quite sharp and lack intermediate forms. Most economically valuable traits in cultivated plants and domestic animals are quantitative; therefore, understanding how quantitative traits are inherited is crucial for breeding work.
Quantitative traits are generally more variable than qualitative ones. This is due to two main reasons. First, hereditary differences among individuals regarding a particular quantitative trait are usually driven by the interaction of multiple pairs of polymeric genes, with each Gene exerting a substantial effect on the trait's development. Specific combinations of polymeric genes that determine a quantitative trait shift its expression in a positive direction, whereas others shift it negatively. In contrast, for qualitative traits, differences between individuals are mostly determined by just one, two, or occasionally three pairs of alleles. Second, compared to qualitative traits, quantitative traits are typically much more strongly influenced by environmental factors. Furthermore, different factors often act in opposite directions on the phenotypic expression of the genes.
When studying the inheritance of quantitative traits, specific statistical parameters are used to characterize the degree to which such traits are expressed. The primary parameters are the arithmetic mean (x), the standard deviation (σ), and the coefficient of variation (CV).
The trait under investigation is measured across all individuals in the studied group, and the resulting data are divided into an arbitrary yet relatively small number of classes, each grouping individuals that are more or less similar in their trait values. In other words, a variation series is constructed, which is conveniently represented as a histogram—bars whose bases correspond to the interval adopted for a given class and whose heights correspond to the number of variants (i.e., the number of individuals belonging to that class). A distribution curve can be plotted similarly (Fig. 3.7).

Fig. 3.7. Weight distribution of Kostroma breed cows over five years of age
After constructing the variation series, the arithmetic mean (x) is calculated, providing an idea of the typical degree of trait expression in the studied group of individuals. The arithmetic mean is calculated using the formula
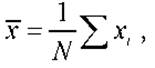
where xi represents the values for individual specimens, and N is the total number of individuals.
The arithmetic mean does not reflect the degree of trait Variability within the studied group: variation series with the exact same arithmetic mean can differ significantly in variability. The most common measure of variability (the spread of trait distribution) is the standard deviation (σ), which is calculated using the formula
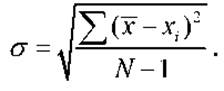
The standard deviation allows for the comparison of variability for the same trait across different groups of individuals. However, this metric is unsuitable for comparing the variability of traits characterized by different Units of Measurement, such as weight and height. In such cases, the coefficient of variation (CV) is calculated, which represents The ratio of the standard deviation to the arithmetic mean, expressed as a percentage:
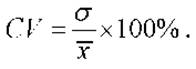
It should be noted that the coefficient of variation should not be used where the standard deviation suffices—mathematically, the latter characterizes trait variability with much greater precision.
It is also important to understand that any empirical variation series is a random sample containing a limited number of variants, and therefore it does not entirely reflect the population's true value and variability for the studied trait. The reliability of biometric indicators determined for an empirical sample strongly depends on the number of individuals it contains: the larger the sample, the closer these indicators are to their true values.
As a rule, quantitative traits depend on polymeric genes, which accounts for certain features of their inheritance. Nevertheless, the hereditary transmission of quantitative traits is based on the same phenomena of segregation and gene recombination as the transmission of qualitative traits. When crossing individuals that differ in a quantitative trait, some offspring in F2 may exhibit a higher or lower degree of trait expression than the original parents. If both parents carry genes that increase this value as well as those that decrease it, F2 descendants with a higher concentration of plus or minus genes than the parents will appear. Assume, for example, that polymeric genes A, B, and C increase trait expression while their alleles a, b, and c decrease it, and that one parental form has the genotype AABBcc while the other is aabbCC. Then, among the F2 individuals, some will possess the genotype AABBCC or aabbcc; for the former, the trait value will be higher, and for the latter, lower than that of the parents. This potential to expand the boundaries of hereditary variability in a quantitative trait is of great practical significance. In many cases, this approach allows breeders to isolate forms from F2 that are genetically and phenotypically more valuable than the original parental lines.
In its simplest form, The Theory of polymeric genes assumes that any quantitative trait is determined by the interaction of several additively acting genes that have an approximately equal effect on the trait. In reality, polymeric genes often differ in the "strength" with which each determines the expression of a given trait: depending on the degree of impact on the quantitative trait, genes are categorized into Major and minor genes, as well as those with intermediate effects. A pleiotropic gene may act as a major gene for certain traits and as a minor gene for others. Furthermore, the interactions among polymeric genes may be non-additive and are frequently complicated by complementarity, epistasis, or the presence of weaker modifier genes whose effects are difficult to account for.
More or less accurately defining the specific set of genes that govern a quantitative trait is a challenging task. In crop and livestock production, a constant need arises to determine to what extent the variability of a quantitative trait is due to genetic causes versus environmental modifications. The success of Selection programs based on a given trait depends directly on solving this problem. In such cases, calculating the heritability coefficient of the trait can be extremely useful. This can be accomplished even without identifying the specific genes underlying the trait. The heritability coefficient is a value indicating the proportion of the genetic component within the total phenotypic Variability of the studied quantitative trait. Phenotypic variability is characterized by the standard deviation or its square, the variance (σ2). The total phenotypic variance (σ2p) comprises the variance dependent on genetic diversity among individuals (σ2G) and the variance caused by environmental influences (σ2E). The heritability coefficient h2 is defined by the equation:
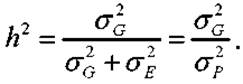
Several different Methods exist for calculating the heritability coefficient. The simplest approach is based on comparing the variability of a quantitative trait in a genetically uniform group of individuals with the variability of the same trait in a group sampled from a heterogeneous population of the same species. A genetically uniform group is obtained by performing close Inbreeding or self-pollination over many generations.
Last update: 11/08/2026
Editorial and Educational Adaptation: This material has been compiled based on the primary/original source text. The project team performed an editorial review, corrected technical inaccuracies, structured sections, and adapted the content for an educational format.
What was processed:
- elimination of formatting defects (OCR errors, structural breaks, corrupted characters);
- editorial organization of content;
- standardization of terminology in accordance with academic sources;
- verification of factual statements against the original source text.
All mentions of the author, publication year, and origin of the primary text have been preserved in accordance with the source.