BOTANY VOLUME 4 - ECOLOGY - 2007
12. FUNDAMENTALS OF PLANT ECOLOGY
12.3. The Time Factor and Non-Linear Responses
12.3.1. Phenology and Biological Timing
In botanical and ecological observations, The Use of rigid linear measures of time (hours, calendar dates) is problematic when comparing organismal responses linked to developmental dynamics. Under certain circumstances, individuals of the same plant species, for example, may flower just 40 days after sowing, while under other conditions it may take 80 days. For comparative purposes, it is preferable to select a specific developmental phase or phenological state (such as the opening of the first flower) rather than a fixed calendar date. Attention is thus directed toward phenology (visible changes in state during development), aligning observations with phenophases. Characteristic phenophases include germination, leaf unfolding, flowering, fruiting, leaf fall, or the onset of senescence (developmental physiology, see 7.7). The sequence of these events is constant, whereas the duration of the intervals between them is variable.
Phenometry measures changes in specific parameters throughout a plant's developmental phases. Phenological series represent the result of the integration of external conditions and the plant's internal state—in other words, a biological calendar. Because such biologically integrated data are valuable for characterizing weather patterns, phenological dates are utilized by meteorological services. Retrospectively, these dates are of paramount importance for assessing climate change, as no "normal" meteorological measurements possess comparable sensitivity. To resolve such tasks (under conditions not limited by drought), the so-called thermal time is best suited—the product of summing temperatures (usually daily means) over a duration of a certain length (if measured in days, daily temperatures are summed; eng. day degrees); hourly mean values can also be summed (degree hours). Close correlations between such "weighted" measures of time and phenology can frequently be observed.
It is often of particular interest to understand the dynamics of vegetative development between two major phenological milestones, such as germination and flowering. A frequently used temporal measure for the sequential process of vegetative development is the plastochron. A plastochron corresponds to the time interval between The Emergence of two successive leaves on the same SHOOT. The age of a developing shoot can be roughly estimated from the number of emerged leaves since a specific starting point (a 5-leaf stage equals approximately 5 plastochrons). Such measurements play a particularly important role in agricultural research for determining shoot age. Data expressed in calendar days would be of lesser value for comparisons.
12.3.2. Non-Linearity and Frequency
Non-linearity in the relationships between processes and the environment is the rule rather than the exception. Typical Examples include the Effect of Temperature on Respiration and growth, or light and CO2 on Photosynthesis (see 13.7). Measurement data obtained for one range cannot be simply extrapolated to another, as would be the case with linear relationships (within a certain confidence interval), unless the shape of the curve is known.
A particular problem in this context is posed by strong and irregular fluctuations in environmental conditions, because their low and high measured values have disproportionate effects. Alongside knowledge of the graphical relationship between a process and environmental conditions, reconstructing or predicting these processes requires environmental parameters with high temporal resolution rather than mean values. On a standard reaction norm curve, mean values of temporally fluctuating environmental conditions would yield a false picture that does not reflect their actual impact on the process.
This can be illustrated particularly clearly using the light-photosynthesis response curve (Fig. 12.3). Photosynthesis in the leaves of most plants approaches saturation at 25% of full sunlight. An increase in light intensity between this saturation threshold and the maximum (100%) in leaves oriented perpendicular to the light rays yields no increase in photosynthesis. Conversely, at very low light levels, photosynthesis is extremely sensitive to the slightest fluctuations in illumination. Accurate determination of varying radiation intensities in the low-light range is of great importance, whereas in the saturation range it is practically negligible. However, the arithmetic mean of all measured values would assign equal weight to photosynthetic intensities in both the saturation and low-light ranges.
Class="center">Fig. 12.3. Non-linear responses to a variable environment. Most life processes, such as photosynthetic productivity (B), respond to environmental changes in a non-linear manner, e.g., to temporally varying light intensity (A). Mean values (x) of such environmental states are unsuitable for predicting process intensity based on the reaction norm (B). In this example, temporal variations in values within range S are insignificant because the process under consideration is saturated in this region. Changes to the left of x (the unsaturated region) have an effect, but in region K in a non-linear manner. At very low values of environmental variables, the relationships may initially assume a linear character L (eng. initial slope). To calculate the cumulative or mean process intensity in this example, each individual light intensity value must be paired with its corresponding photosynthetic intensity value, or the environmental factor state must be represented as a frequency distribution and multiplied by classes
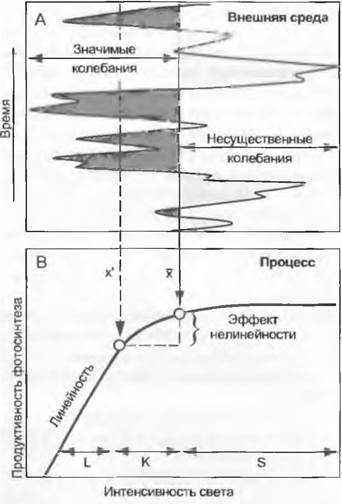
Thus, since time series of environmental variables cannot generally be averaged for impact-analysis purposes, it is necessary either to have original temporal data recorded at sufficiently fine intervals (e.g., less than 2 min for light) or to tabulate results by illumination classes. For practical reasons, the latter option is usually chosen. The frequency distribution of environmental states is a convenient measure for assessing temporally varying impacts on plants. Every evaluation of environmental influence must be based on the "temporal fabric" of its intensity (hence the histogram; histos — fabric) or the concentrations of the influencing factor in question. A frequency diagram is, to a certain extent, the emblem of functional ecology (see 12.4).
Last update: 07/08/2026
Editorial and Educational Adaptation: This material has been compiled based on the primary/original source text. The project team performed an editorial review, corrected technical inaccuracies, structured sections, and adapted the content for an educational format.
What was processed:
- elimination of formatting defects (OCR errors, structural breaks, corrupted characters);
- editorial organization of content;
- standardization of terminology in accordance with academic sources;
- verification of factual statements against the original source text.
All mentions of the author, publication year, and origin of the primary text have been preserved in accordance with the source.