Principles of Biochemistry Volume 1 - A. Lehninger 1985
Biomolecules
Water
Weak acids have characteristic titration curves
Titration is used to determine The amount of acid in a given solution. This Procedure involves adding a solution of a base (typically sodium hydroxide, NaOH) of precisely known concentration to a measured volume of the acid solution being analyzed. The base solution is added in small increments until the acid is completely neutralized; the neutralization point is determined either by a color change of an indicator or by using a pH meter. Based on the volume and concentration of the added base solution, the concentration of the acid in the test solution can be calculated.
If, during the titration of a weak acid, the pH of the test solution is carefully measured after each addition of the base solution up to the neutralization point, one can not only determine the acid concentration but also obtain important additional information about the solution under analysis. The graph showing the dependence of the pH of the titrated solution on the amount of added base is called a titration curve. Fig. 4-10 shows The titration curve of acetic acid (a typical weak acid). Let us trace the titration of a 0.1 M acetic acid solution with a 0.1 M NaOH solution at 25°C, keeping in mind that this process involves two reversible equilibria:
Class="center">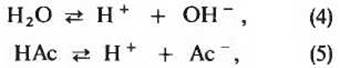
which are characterized by equilibrium constants numerically equal, respectively, to
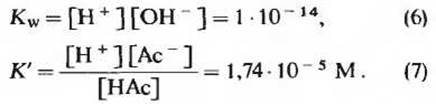
At the beginning of the titration, before The addition of NaOH, acetic acid is already slightly ionized, and the degree of its ionization can be calculated from the ionization constant (7). Let us attempt to do this. For simplicity, we will assume that the degree of ionization of acetic acid is extremely small, and therefore the concentration of its undissociated molecules does not differ significantly from its total concentration of 0.1 M.
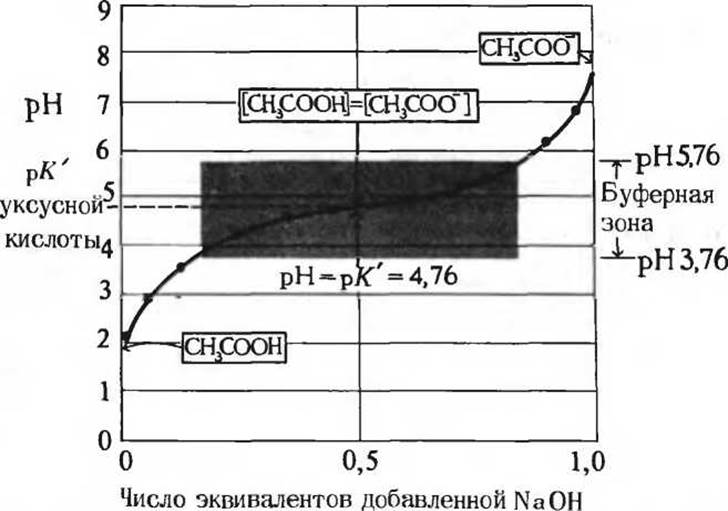
Fig. 4-10. Titration curve of acetic acid (see text for details). After each addition of standard NaOH solution to the titrated acetic acid solution, the pH of the mixture is measured. This value is plotted on the ordinate axis, while the abscissa axis represents the fraction of the total amount of NaOH required to neutralize the acetic acid, i.e., to reach pH ≈ 7. The resulting points allow the titration curve to be constructed. The boxes indicate the predominant Ionic Forms of acetic acid at the corresponding pH values. At the midpoint of the titration curve, the concentrations of the proton donor and proton acceptor are equal. The pH value at this point is numerically equal to the pK' value of acetic acid.
The colored zone represents the region within which the system exhibits buffering properties.
When we add portions of the NaOH solution to the titrated acetic acid solution, OH- ions combine with H+ ions to form H2O molecules. Meanwhile, the concentrations of H+ and OH- ions in the solution must at all times satisfy the ion product of Water Kw = [H+][OH-] = 1∙10-14. However, as soon as free H+ ions are bound by OH- ions, a certain portion of the undissociated HAc molecules immediately undergoes further dissociation, so that equilibrium is re-established, characterized by the dissociation constant of acetic acid (7). Thus, as new portions of the NaOH solution are added during the titration, the degree of ionization of HAc increases. Consequently, the concentration of HAc in the solution gradually decreases, while the concentration of Ac- increases, since equilibria (4) and (5) at each stage of the titration are determined by equilibrium constants (6) and (7). At the titration midpoint (Fig. 4-10), which corresponds exactly to the addition of 0.5 equivalents of NaOH, half of the initial acetic acid is in the dissociated form, meaning that the concentration of the proton donor [HAc] equals the concentration of the proton acceptor [Ac-]. At this midpoint, a very important relationship holds: the pH of a solution containing equal molar concentrations of acetic acid and acetate ion—specifically pH 4.76—is exactly equal to the pK' value of acetic acid, which can be easily verified by comparing the pK' values given in Table 4-4 with the titration curve shown in Fig. 4-10. We will soon understand The Significance of this important relationship, which holds true for all weak acids.
As we continue the titration by adding more portions of the NaOH solution, the remaining undissociated acetic acid molecules are gradually converted into acetate ions (CH3COO-), while H+ ions are removed from the solution by reacting with OH- ions to form water. Eventually, we reach the titration endpoint (at approximately pH 7.0), where all acetic acid molecules have been stripped of the protons that bound to the OH- ions, resulting in The formation of H2O and acetate. Throughout the entire titration process, two interrelated equilibria (4) and (5) coexist, and the ratio between the concentrations of the substances participating in these equilibria constantly corresponds to the numerical values of the equilibrium constants. Both of these equilibria are reversible and, being ionic in nature, are established almost instantaneously. Therefore, the titration procedure can easily be reversed. Starting from the neutralization point, we can add H+ ions to the resulting solution, back-titrating the acetate ions, and thus return the solution to its initial state. After correcting for the volume change during titration, we obtain precisely the same curve shown in Fig. 4-10. During the back-titration, the added H+ ions bind to Ac- ions, leading to the formation of acetic acid (HAc); as H+ ions are added, the [Ac-]/[HAc] ratio decreases until it reaches the initial state that existed before the titration of the acetic acid solution with NaOH began.
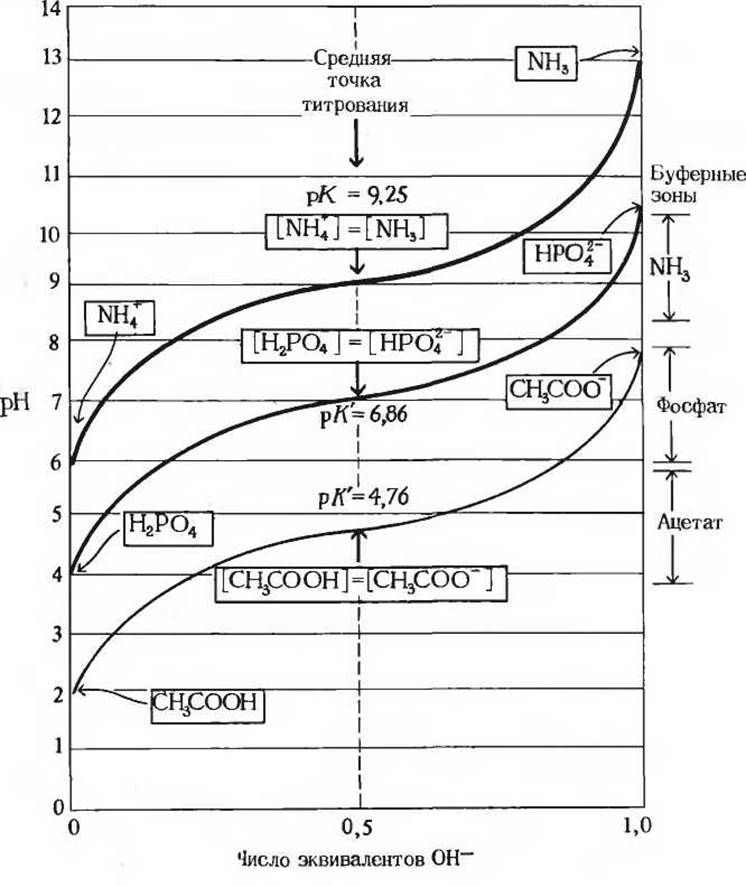
Fig. 4-11. Comparison of the titration curves of three weak acids: acetic acid, H2PO4-, and NH4+. The boxes indicate the predominant forms of these compounds at the corresponding pH values. The buffer zones for each system are marked on the right. Conjugate acid-Base Pairs serve as effective buffers at pH values where the compounds acting as proton Donors are 25–75% ionized.
Fig. 4-11 compares the titration curves of three weak acids with vastly different dissociation constants, namely acetic acid (pK' = 4.76), the H2PO4- ion (pK' = 6.86), and the ammonium ion NH4+ (pK' = 9.25). Although the titration curves of all these acids have the same shape, they are shifted along the pH axis simply because the three acids differ in strength. Acetic acid is the strongest of the three and gives up its proton to the OH- ion more readily than the others, because it has the largest ionization constant K’ and, accordingly, the lowest pK' value. At pH 4.76, acetic acid is already 50% dissociated. It is more difficult to detach a proton from the H2PO4- ion, which is 50% dissociated at pH 6.86. The NH4+ ion is the weakest of the three acids, and its 50% dissociation occurs only at pH 9.25.
We now come to the most important point regarding the titration curves of weak acids: The Nature of these curves demonstrates that a weak acid and its anion can be used as a buffer.
Last update: 06/08/2026
Editorial and Educational Adaptation: This material has been compiled based on the primary/original source text. The project team performed an editorial review, corrected technical inaccuracies, structured sections, and adapted the content for an educational format.
What was processed:
- elimination of formatting defects (OCR errors, structural breaks, corrupted characters);
- editorial organization of content;
- standardization of terminology in accordance with academic sources;
- verification of factual statements against the original source text.
All mentions of the author, publication year, and origin of the primary text have been preserved in accordance with the source.