Practical Protein Chemistry - A. Darbre 1989
Peptide mapping of proteins
Peptide mapping in practice
Two-dimensional peptide mapping
Purified Proteins are subjected to Trypsin Hydrolysis (occasionally using a-Chymotrypsin) in solution, suspension [26], or gel [19]. When dealing with limited amounts of starting material, prior radioactive labeling is required [6, 19, 20]. Unlabeled Peptides can be treated with fluorescent Reagents after Separation, with the resulting derivatives often matching the detection sensitivity of radioactive labels [21, 55, 60, 70].
Class="center">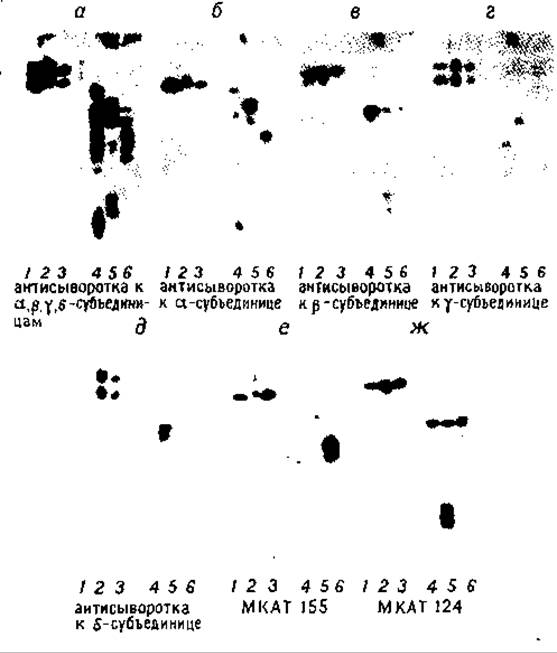
FIG. 7.2. Intact Acetylcholine Receptor subunits from Torpedo (I), Electrophorus (II), and bovine Muscle (III), along with their V8 protease hydrolysates, separated on a 15% PAGE in the presence of SDS and electrophoretically transferred to diazotized paper. 1 — I (10 ng); 2 — II (20 ng); 3 — III (50 ng); 4 — hydrolysate I (40 ng, 1 : 10 by weight); 5 — hydrolysate II (80 ng, 1 : 10); 6 — hydrolysate III (100 ng, 1:10). Detection using equal amounts of antisera against a,ß,y,δ-subunits of I (a), respective antisera against a,ß,y,δ-subunits (b–e), and Monoclonal Antibodies (mAbs) to a- and ß-subunits (f and g) [8]. (By permission of the Chemical Society.)
Protein samples intended for peptide mapping are frequently found in large volumes. To concentrate them and simultaneously remove undesired buffer components, the protein is precipitated by Treatment with 50% (w/v) trichloroacetic acid (2 h at 4 °C is generally sufficient for precipitating most proteins) and collected by centrifugation. When working with very small quantities of radiolabeled proteins, an unlabeled ("cold") carrier protein (such as immunoglobulin) is added as a "seed" to ensure complete precipitation. Since neither the carrier protein nor the protease is labeled, their concentration in solution is limited solely by the Sample application volume on the plate (0.25–5 µL). A total protein content >100 µg per sample is discouraged, as it results in smeared bands on the map, and a substantial fraction of the radioactive material may remain at the origin.
The protein sample is dissolved or suspended in a volatile buffer (0.5 mL of 50 mM ammonium bicarbonate), to which the enzyme is added (1–50 µg for radioactive samples, or at a 1 : 100 ratio for unlabeled proteins). The mixture is incubated for 6–24 h at 37 °C. Occasionally, adding a second aliquot of trypsin is necessary to ensure complete Digestion, as the enzyme loses activity over time due to autoproteolysis.
Radiolabeled proteins embedded in gel slices are equilibrated with ammonium bicarbonate buffer, and proteolysis is carried out as described above. According to some protocols, an alkylation or oxidation step of the protein is recommended prior to Enzymatic hydrolysis [26, 61]. The resulting small fragments, which are more soluble than the intact protein, are passively eluted from the gel. The supernatant is concentrated via lyophilization, which simultaneously removes volatile buffer components.
The dried mixture of short peptides is then dissolved in a small volume (10 µL) of Electrophoresis buffer and applied to Glass plates coated with a 0.1–1 mm layer of silica gel or Cellulose. Unfortunately, commercially available plates often feature uneven coatings, which can be detected by inspecting the plate against the light (dark bands or spots indicate variations in layer thickness). Rejected plates can be utilized for preliminary trials: establishing run times, determining electrophoresis pH, or testing solvent systems for Chromatography. Whatman 3 MM filter paper sheets can also serve as the solid support [36, 37]. Despite significant peptide losses resulting from adsorption, paper chromatography remains useful for monitoring peptide homogeneity (Section 7.3.2.1).
The sample solution should be applied in small increments (0.25 µL) to keep the origin spot as compact as possible. Each droplet is dried rapidly using a Hair dryer or fan. Charged colored Dyes are also applied to the plate; these migrate a specific distance and serve as visual markers to monitor the process. Electrophoresis is performed using buffers containing pyridine, acetic acid, Water, and occasionally butanol [26, 60] (Table 7.1). The pH of the solution can be adjusted to develop various separation systems. It is generally convenient to perform electrophoresis first, followed by chromatography; however, this specific sequence is not strictly mandatory.
Table 7.1. Conditions for two-dimensional separation of tryptic peptides on thin-layer silica gel plates
|
200×200 mm plates with a layer thickness of 0.1–0.25 mm. |
|
First dimension: electrophoresis |
|
pH 3.5, pyridine — acetic acid — water (2:20:978), 1000 V, 45 min |
|
pH 6.5, pyridine — acetic acid — water (100:3:897), 1000 V, 40 min |
|
pH 4.7, butanol — pyridine — acetic acid — water (2:1:1:18) |
|
Second dimension: chromatography at 25 °C |
|
Chloroform — methanol — ammonia (2:2:1) |
|
Propanol — ammonia (7:3) |
|
Butanol — pyridine — acetic acid — water (97 : 75 : 15 : 60), pH 5.3 |
The electrophoretic plate is gently moistened with the appropriate buffer, taking care not to smudge the sample application spots, and subjected to a potential of 1000 V for 40–90 min (for a 200×200 mm plate). It should be noted that this Procedure presents safety hazards, and all electrical equipment must be inspected periodically by qualified personnel. Upon completion of electrophoresis, the plate is removed and dried overnight in a fume hood. Because the Solvents used are volatile, no odor of acetic acid should remain once fully dried. When conducting comparative analyses of multiple samples, it is crucial that both the electrophoretic and chromatographic Procedures are carried out under identical conditions.
The chromatographic behavior of peptides is governed by the COMPOSITION OF THE solvent system employed. Increasing the proportion of organic components enhances the relative mobility of hydrophobic peptides due to the hydrophilic Nature of the stationary phase. Several solvent systems have found widespread application [26, 60], though various modifications are utilized to optimize separation conditions for specific cases (Table 7.1).
For chromatography In the second dimension, the plates are placed in glass chambers. The sample application spots should be positioned ~1 cm above the solvent level. The process continues until the solvent front reaches or nearly reaches the top edge of the plate (which takes about 5 h for a 200×200 mm plate). After air-drying, if labeled samples were analyzed, autoradiography is performed directly or, in the case of low-energy isotopes, by spraying the chromatogram with a scintillator solution followed by fluorography [3].
Detection of unlabeled peptides can be achieved through various Methods [55], but most commonly involves fluorescamine in acetone [60]; the resulting fluorescent spots are subsequently visualized under UV light (366 nm) (Chapter 8). Results can also be recorded continuously as autoradiographic prints on X-ray film or by photographing the plates following treatment with the fluorescent reagent (<24 h).
If comparisons of the resulting maps raise doubts regarding the Homology of two proteins, the procedure is repeated by applying an equal amount of each sample to a single plate. Following chromatogram development, similarities or differences in spot locations become much more apparent.
Difficulties encountered during two-dimensional mapping typically stem from poor plate quality (uneven coating), improper sample application (excessive protein load or insufficient radioactivity), and suboptimal conditions during Protein Digestion, chromatography, or electrophoresis. It is worth noting that while the majority of peptides carry a positive charge in electrophoresis buffer, negatively charged peptides may also be present in the mixture. Therefore, a supplementary run is recommended, where the sample is applied to the lower center of the plate and subjected to electrophoresis for 30 min. The peptide mobility in the first dimension and the optimal duration for the preparative run can then be determined using the approaches described. Fig. 7.3 presents several two-dimensional peptide maps to illustrate the results achievable with this method.
7.3.2.1. Assessment of Peptide Purity. Peptide homogeneity can be evaluated via two-dimensional separation on a large sheet of Whatman 3 MM filter paper (460×570 mm). First dimension — electrophoresis in pyridine — acetic acid — water (10:100:2800), pH 3.6, 2.2 kV, 80 min (systems operating at other pH values may also be used). Second dimension — chromatography in n-butanol — pyridine — acetic acid — water (150:100:30:120). Spot localization is performed using fluorescamine or the ninhydrin-cadmium reagent.
Last update: 06/08/2026
Editorial and Educational Adaptation: This material has been compiled based on the primary/original source text. The project team performed an editorial review, corrected technical inaccuracies, structured sections, and adapted the content for an educational format.
What was processed:
- elimination of formatting defects (OCR errors, structural breaks, corrupted characters);
- editorial organization of content;
- standardization of terminology in accordance with academic sources;
- verification of factual statements against the original source text.
All mentions of the author, publication year, and origin of the primary text have been preserved in accordance with the source.