Genetics - A. V. Sivolob 2008
Population Genetics
Factors of the Dynamics of Population Genetic Structure
Genetic Drift
Population size is always finite. If (in the absence of Selection, mutation, and migration) a population is characterized by a small effective size Ne, The formation of the gamete pool and Gene pool in the next generation significantly increases the probability of random deviations from the mean frequency of a given allele. This process of undirected allele frequency changes in small populations driven by random factors is called genetic drift.
These random fluctuations cause unpredictable changes in gene frequencies across generations (Figs. 8.5, 8.6). The ultimate outcome of this process is either the elimination of an allele from the population or its fixation (reaching a frequency of 100%), with the process occurring more rapidly the smaller the value of Ne.
Class="center">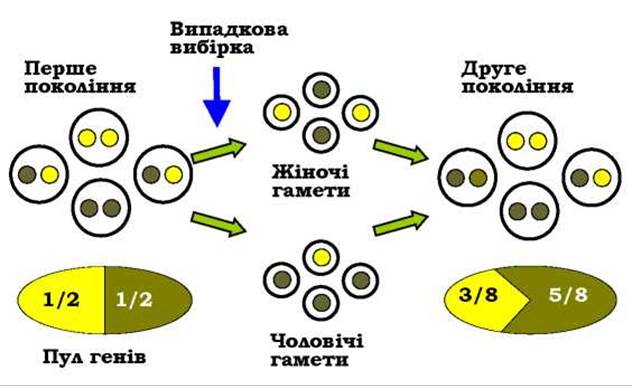
Fig. 8.5. Random changes in gene frequencies over a single generation in a population of four hermaphroditic individuals, where reproduction occurs through random gamete union (after Kimura, 1985)
The stochastic and unpredictable nature of Changes in the genetic Structure of a specific population necessitates a probabilistic approach, which is the only way to study genetic drift. The probability of an allele frequency deviating from its initial value can be estimated using standard deviations (σ). The variance of allele frequency is determined by the formula
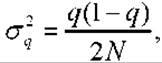
where q is the frequency of allele a in the initial (i-th) generation, and N is the size of the subsequent progeny (t+1) generation. Hence, the standard deviation of the gene frequency in the progeny generation is
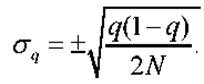
The larger the deviation of the allele frequency from its initial value, the lower its probability: 68.27% of all possible random allele frequency deviations fall within the interval from q - σ to q + σ, 95% fall within the interval from q - 2σ to q + 2σ, and so on.
As a result of random frequency fluctuations across generations, both fixation and elimination of alleles occur, leading to an increase in population homozygosity and a loss of Variability (Figs. 8.6, 8.7). The rate of this variability loss is k = 1/(2N). In other words, in a group of N randomly mating individuals, heterozygosity decreases by a factor of 2N in each generation:
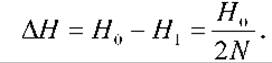
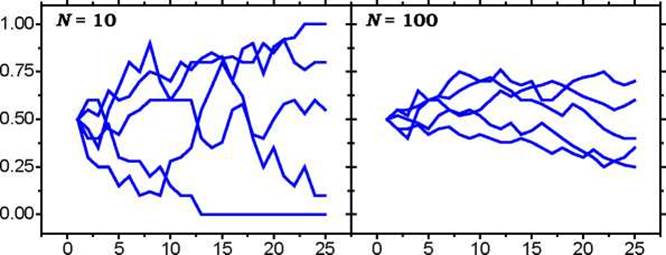
Fig. 8.6. Genetic drift trajectories of gene frequencies.
The abscissa represents the number of generations, and the ordinate represents the gene frequency. The curves were obtained from computer simulations modeling populations of 10 and 100 individuals with an initial gene frequency of 0.5
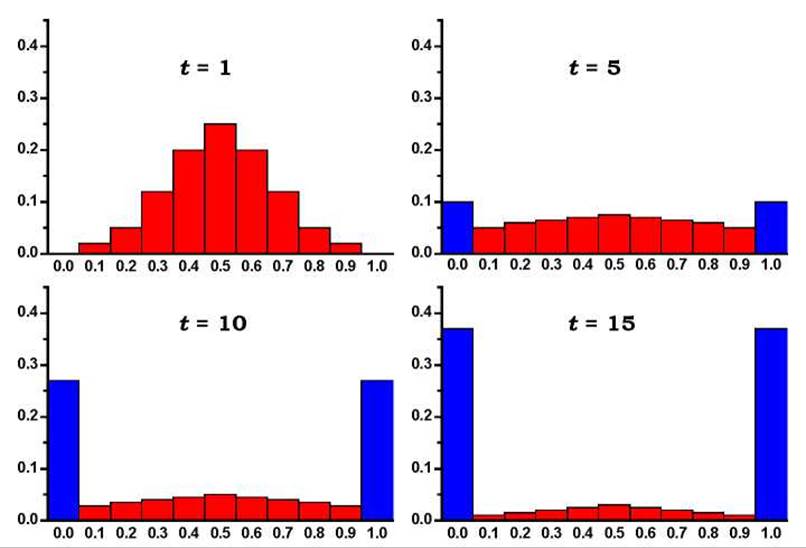
Fig. 8.7. Changes in gene frequency distribution as a result of genetic drift: the abscissa shows the allele frequency, and the ordinate shows the proportion of populations with the corresponding frequency. The populations consist of 5 hermaphroditic individuals with random mating; the initial gene frequency (at t = 0) is 0.5. Distributions are shown for the 1st, 5th, 10th, and 15th generations. Blue bars represent the proportion of populations in which the allele has been lost or fixed (after Kimura, 1985)
Heterozygosity in a group of N individuals after t panmictic generations can be determined by the formula
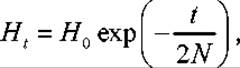
where Ho is the initial heterozygosity, and H is the heterozygosity after t generations.
In the same manner (i.e., at a rate of 1/(2N) per generation), genetic drift affects another measure of variability: the number of loci that have not undergone fixation or elimination of one of the alleles.
The main consequences of genetic drift are:
✵ unpredictable changes in allele frequencies;
✵ an increase in the proportion of homozygotes;
✵ depletion of the gene pool (loss of alleles).
Genetic drift significantly impacts the genetic structure of a population during demographic fluctuations, when the population size drops sharply (population bottleneck effect), and the gene pool of subsequent generations is determined by a small group of founding individuals (founder effect). Although the population size may subsequently increase significantly, The genes of all individuals trace back to a small number of genes present by chance in the population founders. This applies in particular to human populations at certain stages of Homo sapiens evolution (Chapter 7). The founder effect occurs both when a population passes through a bottleneck and when a species colonizes new isolated territories (such as islands).
Last update: 11/08/2026
Editorial and Educational Adaptation: This material has been compiled based on the primary/original source text. The project team performed an editorial review, corrected technical inaccuracies, structured sections, and adapted the content for an educational format.
What was processed:
- elimination of formatting defects (OCR errors, structural breaks, corrupted characters);
- editorial organization of content;
- standardization of terminology in accordance with academic sources;
- verification of factual statements against the original source text.
All mentions of the author, publication year, and origin of the primary text have been preserved in accordance with the source.