BIOLOGY Volume 2 - A Guide to General Biology - 2004
11. QUANTITATIVE ECOLOGY
11.4. Synecological Study
11.4.3. Recording and Presentation of Data
Data should be recorded immediately upon collection in a special field notebook or an appropriate notepad. For synecological studies of marine habitats, it is very convenient to use pre-prepared data sheets (Tables 11.7 and 11.8). These are best carried in a clipboard folder (along with a pencil), and the folder inside a plastic bag in case of rain. Once all the data are collected, they must be presented in a clear graphical form that demonstrates the relationship between organisms and the abiotic environment. Methods for such presentation are discussed in the Appendix (P2.3) and include, for example, presence-absence plots, kite diagrams, and histograms. The construction of ecological (trophic) pyramids is described in Section 10.3.4. Examples of the four mentioned methods of data presentation are given in Figs. 11.22-11.24.
Class="center">Table 11.7. Sample data sheet for marine ecology field records
1. Surveyed site and its coordinates ........................... 2. Profile nature (rocky, sandy, muddy, dune) ........................... 3. Schematic maps of the surveyed area showing transect locations ........................... 4. Relief features (aspect, slope steepness, etc.) ........................... 5. Date........................................ 6. Weather conditions.................... 7. Tide data: predicted high Water ....... predicted low water ........ observed high water............ observed low water ............ predicted tide height . 8. Notes and recording key (Abundance scales — % cover, benchmark heights, e.g., h1, etc.) |
Table 11.8. Field data recorded during a synecological study of marine habitats
Station name |
Horizontal distance from baseline, m |
Height on levelling staff (h2), m |
Height difference (h2 — h1, etc.), m |
Height above low water mark, m |
Time exposed to air |
Time submerged |
Animals (species and abundance) |
Plants (species and abundance) |
Notes |
Table 11.9. Distribution of four common species of periwinkles (Littorina) on the rocky shore of the Dale Peninsula, Pembrokeshire, April 1976. These data are presented graphically as a kite diagram in Fig. 11.22
Height above low water level, m |
L. neritoides N abundance |
L. neritoides N abundance |
L. neritoides N abundance |
L. neritoides N abundance |
||||
9-10 |
63 |
10 |
— |
— |
— |
— |
— |
— |
8-9 |
54 |
10 |
— |
— |
— |
— |
— |
— |
7-8 |
7 |
4 |
3 |
2 |
— |
— |
— |
— |
6-7 |
— |
— |
8 |
4 |
1 |
1 |
— |
— |
5-6 |
— |
— |
17 |
8 |
3 |
2 |
2 |
2 |
4-5 |
— |
— |
6 |
4 |
13 |
6 |
9 |
4 |
3-4 |
— |
— |
1 |
1 |
6 |
4 |
16 |
8 |
2-3 |
— |
— |
— |
— |
2 |
2 |
5 |
4 |
1-2 |
— |
— |
— |
— |
1 |
1 |
1 |
1 |
0-1 |
— |
— |
— |
— |
— |
— |
— |
— |
Abundance scale based on numbers (N): ≥20 = 10; 19—15 = 8; 14—10 = 6; 9—5 = 4; 4—2 = 2; 1 = 1 |
||||||||
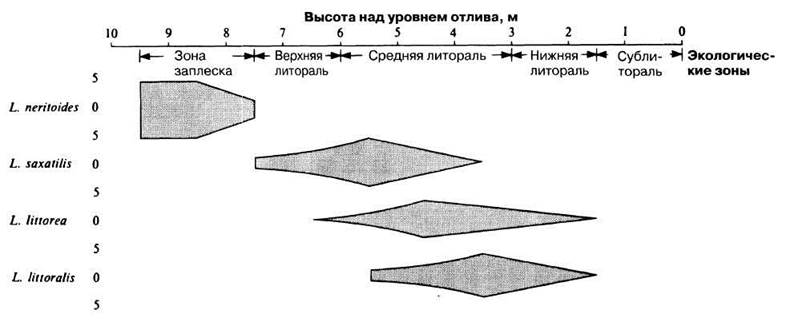
Fig. 11.22. Kite diagram showing the distribution of four common periwinkle species (Littorina) on the rocky shore of the Dale Peninsula (Pembrokeshire; April 1976). Data (abundance scores) are taken from Table 11.9.

Fig. 11.23. Summary diagram of the algal zonation along a rocky shore. The following data are presented: A — shore profile; B — sampling points A — Y at 10 m intervals; C — ecological zonation of the shore According to the duration of tidal immersion; D — species presence-absence histogram; E — histogram of the total number of species at each station point.
These data were collected by sixth-form students along an interrupted belt transect using a 1 m2 quadrat on the Gower Peninsula (South Wales) in July 1981.

Fig. 11.24. Biomass pyramids for five rocky shore communities associated with different algal producers. Numbers represent biomass in g/m2. Grey rectangles represent producers, hatched rectangles represent primary consumers (herbivores and detritivores), and vertical lines at the apex of the pyramids represent secondary consumers (carnivores). However, it should not be inferred that each trophic level is entirely sustained by the preceding one. Northumberland coast, March 1969. (After D. A. S. Smith (1970) School Science Review, ASE.)
Last update: 06/08/2026
Editorial and Educational Adaptation: This material has been compiled based on the primary/original source text. The project team performed an editorial review, corrected technical inaccuracies, structured sections, and adapted the content for an educational format.
What was processed:
- elimination of formatting defects (OCR errors, structural breaks, corrupted characters);
- editorial organization of content;
- standardization of terminology in accordance with academic sources;
- verification of factual statements against the original source text.
All mentions of the author, publication year, and origin of the primary text have been preserved in accordance with the source.