Protein Structure and Function: Applications of Bioinformatics Methods - John Rigden 2014
Bioinformatics Methods for Studying the Structure and Function of Disordered Proteins
Disorder Prediction
Propensity-Based Prediction Methods
Conceptually similar to the Methods described above are other propensity-based prediction methods, which evaluate how frequently a specific amino acid property associated with disorder occurs within a given predefined protein segment. GlobPlot (Linding et al. 2003a), for instance, employs scores derived from a scale that reflects the propensity of a given amino acid to reside in a disordered region or a region of regular Secondary Structure. Similarly, DisEMBL (Linding et al. 2003b) utilizes three additional properties: "coils" (According to the DSSP Classification), "hot loops" (loops with high B-factors in the crystallographic structure), and the "REMARK 465" field values, which describe an amino acid's propensity to be missing from the PDB X-ray structure.
Class="center">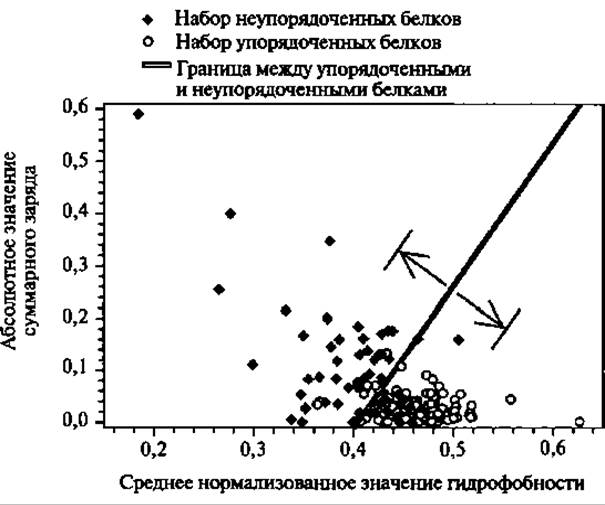
Fig. 5.1. Protein disorder distribution plot. The net charge and mean Hydrophobicity are shown for intrinsically disordered Proteins (indicated by black diamonds) and ordered proteins (indicated by white circles). These protein groups are separated by the line <charge> = 2.743 <hydrophobicity> - 1.109. The arrows point to the boundary lines defining the 95% prediction accuracy zone for disordered proteins and 97% for ordered proteins, achieved by excluding 50% of the total proteins from consideration (Reprinted with permission from Oldfield 2005a. Copyright 2005 American Chemical Society)
A slightly different propensity-based prediction approach is used in Prelink (Coeytaux and Poupon 2005). Prelink relies on two properties of disordered regions (defined as regions linking globular domains): an Amino Acid Composition favoring disorder and a low Abundance or complete absence of hydrophobic clusters. To quantify these two properties, The amino acid distribution in ordered proteins and disordered regions was calculated. Within the query sequence, the distance to the nearest hydrophobic cluster is computed using automated Hydrophobic Cluster Analysis (HCA). This method is based on a two-dimensional helical representation of protein sequences. The disorder score is determined by both the amino acid composition and the calculated distance value.
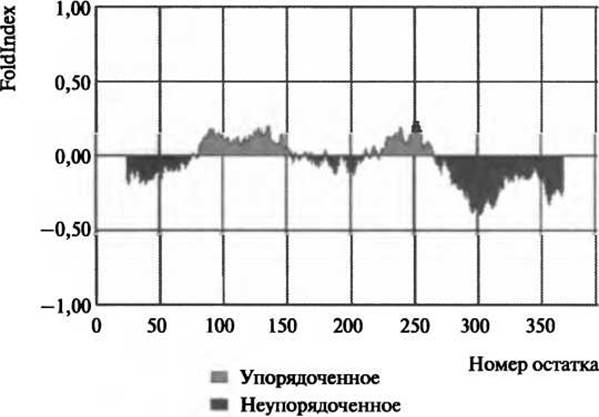
Fig. 5.2. Foldindex profile for the disorder of the p53 protein. The disorder of the p53 tumor suppressor was predicted using the Foldindex method (Prilusky et al. 2005). Dark gray indicates predicted disorder, and light gray indicates order, which is consistent with biophysical data predicting disorder in the N-terminal transactivation domain, the C-terminal tetramerization domain, and the regulatory domain (Bell et al. 2002; Dawson et al. 2003) (Reprinted from Prilusky et al. 2005 with permission from Oxford University Press)
Last update: 06/08/2026
Editorial and Educational Adaptation: This material has been compiled based on the primary/original source text. The project team performed an editorial review, corrected technical inaccuracies, structured sections, and adapted the content for an educational format.
What was processed:
- elimination of formatting defects (OCR errors, structural breaks, corrupted characters);
- editorial organization of content;
- standardization of terminology in accordance with academic sources;
- verification of factual statements against the original source text.
All mentions of the author, publication year, and origin of the primary text have been preserved in accordance with the source.