BIOLOGY Volume 1 - A Guide to General Biology - 2004
10. ORGANISMS AND THE ENVIRONMENT
10.7. Population Ecology
10.7.2. Survivorship Curves
The percentage of individuals that die before reaching reproductive age (prereproductive mortality) is one of the key factors determining population size, and it varies much more widely for a given species than birth rate. The size of many populations remains virtually unchanged for many years. In such cases, an average of two offspring per male-female pair survive to reproductive age.
10.14. The data below represent the average number of fertilized eggs produced by a single female throughout her entire lifetime (fecundity).
Oyster |
100 mln. |
Mouse |
50 |
Cod |
9 mln. |
Spiny dogfish |
20 |
Flounder |
350000 |
Penguin |
8 |
Salmon |
10000 |
Elephant |
5 |
Stickleback |
500 |
Victorian lady |
10 |
Winter moth |
200 |
a) If the sizes of all these populations remain stable, how many reproducing offspring, on average, must each female produce?
б) For each species, record the number of fertilized eggs that must die without producing reproducing individuals, assuming the population remains stable. Express this number as a percentage of the total number of fertilized eggs. This corresponds to prereproductive mortality.
в) Attempt to explain why, According to the table, the fecundity of the stickleback and spiny dogfish is so much lower than that of other fish.
(From Open University, S100, Unit 20, Species and Populations, p. 26.)
If we take the number of newborn individuals as a starting point and then record how many of them remain alive at regular time intervals, we obtain a survivorship curve. The vertical axis of such a graph can represent either absolute values or percentages.
Class="center">
Survivorship curves differ among species. Some typical curve shapes are shown in Fig. 10.18.
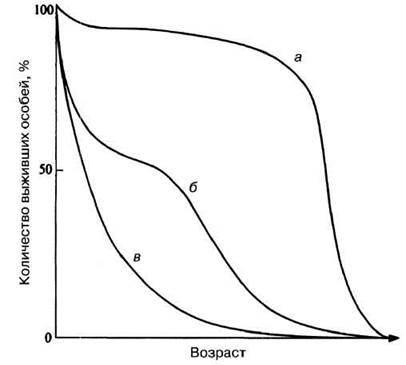
Fig. 10.18. Three types of survivorship curves. See text for explanation.
Most animals and plants exhibit so-called senescence, i.e., a gradual decline in physiological fitness after reaching sexual maturity. As Aging progresses, the probability of an individual dying within any given time interval steadily increases. The immediate causes of death may vary, but the underlying cause is a reduced resistance to environmental factors, particularly diseases.
Curve a in Fig. 10.18 corresponds to an almost ideal situation where the primary cause of death is aging. Such a curve can also be obtained for an annual crop, such as wheat—almost all plants survive until autumn, and then simultaneously fruit and die.
Curve b represents a situation where mortality is particularly high early in life. This is observed, for example, in mountain sheep and humans in developing countries with poor medical care and nutritional deficits. Curve c reflects age-independent mortality, remaining at 50% for any given time interval. In this case, mortality is largely stochastic, occurring before signs of senescence become apparent and independent of the individuals' intrinsic resistance to external factors. A similar curve can be obtained, for example, for the freshwater hydra, whose juveniles are not at any special risk compared to other age groups. However, for the majority of invertebrates and plants, the survivorship curve, while generally conforming to type c, requires adjustment for the increased vulnerability of immature stages—meaning the right-hand side of the graph should drop more steeply.
10.15. Which populations in Fig. 10.18—a or b—require a higher reproductive rate to maintain a stable population size? Explain your answer.
Survivorship curves make it possible to determine the mortality rates of different age groups, i.e., to identify which stages of their life cycle are most vulnerable. By identifying the factors causing mortality during these stages, it is easy to understand how population size is regulated.
10.16. The following averaged data were obtained for sockeye salmon in Canadian waters. Each autumn, every female spawns 3,200 eggs into a depression in the gravel riverbed.
The following spring, 640 fry hatching from these eggs migrate into the lake adjacent to the spawning grounds. They produce 64 smolts (older silvery fish) that leave the lake for the sea a year later. 2.5 years later, two adults (one male and one female) survive from these smolts, returning to their natal river, spawning, and dying immediately afterwards. Calculate the percentage mortality of the sockeye salmon for the following periods of its life cycle:
а) from the time of spawning until the fry migrate into the lake six months later;
б) from The entry of the fry into the lake until the departure of the smolts 12 months later;
c) from the time the smolts leave the lake until the return of the adult fish to the spawning grounds 30 months later.
Plot the survival curve for the sockeye salmon in this Water system (percentage of survivors versus age). What is the pre-reproductive mortality of this species?
(From Open University, S100, Unit 20, Species and Populations, p. 71.)
Last update: 06/08/2026
Editorial and Educational Adaptation: This material has been compiled based on the primary/original source text. The project team performed an editorial review, corrected technical inaccuracies, structured sections, and adapted the content for an educational format.
What was processed:
- elimination of formatting defects (OCR errors, structural breaks, corrupted characters);
- editorial organization of content;
- standardization of terminology in accordance with academic sources;
- verification of factual statements against the original source text.
All mentions of the author, publication year, and origin of the primary text have been preserved in accordance with the source.