Protein Chemistry. Structure, Properties, Research Methods - Shendryk A.N. 2022
Methods for Experimental Study of Protein Structure
Protein Separation Methods
Experimental Electrophoresis Methods - Isoelectric Focusing
To isolate Proteins and analyze their mixtures, a highly efficient Electrophoresis method called isoelectric focusing (IEF) has been developed. It is based on differences in the isoelectric points of proteins. Recall that at its isoelectric point, a protein molecule has a net zero charge. The IEF method makes it possible to distinguish proteins whose pI values differ by as little as 0.01-0.0025 pH units. Polyacrylamide gels (PAGE) or agarose gels are typically used as the supporting medium in IEF.
Initially, the gel is immersed in a solution containing a mixture of low-molecular-weight salts and ampholytes. Sodium sulfate, for instance, can be used as the salt. When an electric current is passed through the gel (in an externally applied electric field), alkali (sodium hydroxide) accumulates near the cathode, and acid (sulfuric acid) near the anode. An ampholyte is an amphoteric substance. Near the cathode, in an alkaline environment, it acquires a negative charge and moves toward the anode. Near the anode, in an acidic environment, the ampholyte is positively charged and begins to move toward the cathode. After some time, the ampholyte migrates away from the electrodes and settles in the region of the Column where the pH equals its isoelectric point. If several ampholytes with different pI values are introduced into the system, they distribute themselves along the column, establishing a pH gradient. This pH gradient is maintained throughout the entire experiment. The substances used as ampholytes contain both acidic and basic groups within their molecules. The basic groups are most commonly amino groups (primary, secondary, tertiary) and guanidino groups. The acidic groups include carboxyl, sulfo, and phospho groups. The generalized formula of an ampholyte is:
Class="center">
The Molecular Weight of the ampholyte should be relatively low, typically ranging from 300-600 up to 1000. This allows them to be easily separated from macromolecules upon completion of the experiment. Nowadays, various ampholytes are commercially mass-produced. Their trade names include "ampholines", "servalytes", etc. They differ in their pH gradient ranges, such as 3-5, 7-10, 3.5-10, 4-4.5, etc. The maximum pH range spans from 2 to 11.
After preparing the column and establishing the pH gradient within it, the protein mixture sample is applied to the gel, and electrophoresis is carried out. As they pass through zones with different pH values, the proteins are "titrated" and alter their net charge. Migration and titration continue until each component reaches a pH value at which the protein is titrated to its isoelectric state. In this zone, the protein loses its electrophoretic mobility (Q=0) and ceases to move along the gel tube. As a result, the initial protein mixture is distributed across the gel tube into very narrow zones according to their pI values. The zone width in IEF is significantly smaller than in conventional electrophoresis.
In essence, isoelectric focusing is an independent research method rather than a mere variant of electrophoresis, as pure electrophoresis does not occur in IEF. Let us briefly review the core principle of isoelectric focusing. Consider The behavior of a protein with a pI of 6 in a tube with a stabilized medium across a pH gradient from 3 to 10 under the passage of a direct electric current (see Fig. 4.8).

Fig. 4.8 Schematic diagram of protein isoelectric focusing
Protein molecules in the region where pH > pI will carry a negative net charge (Wait, in the original text: "в области рН > pI будут нести на себе положительный заряд" — let's translate accurately: positive charge) and move in the electric field toward the cathode. Molecules of the same protein in the region where pH < pI possess a negative charge and will move in the opposite direction, i.e., toward the anode. At the point where pH = pI, the protein molecules are electrically neutral, and the electric field exerts no force on them. At this point, the field effectively compresses the protein molecules from both sides, focusing them into an extremely narrow band.
Thus, the primary difference between isoelectric focusing and electrophoresis is that in standard electrophoresis (EP), protein molecules simply migrate in one direction along the column under METABOLISM/18.html">The Influence of an electric field at speeds proportional to their electrophoretic mobility. Furthermore, the movement of a charged molecule through the column continues until it reaches the corresponding electrode. In IEF, the scenario is different. A charged protein molecule moves toward its pI while continuously diminishing its net charge. The pI is thus the limiting point of the molecule's migration along the column. Upon reaching this point, the molecule stops and cannot be displaced from its pI by diffusion forces in either direction. This is clearly illustrated in the provided figure. For this very reason, the electric field effectively "sorts" the protein mixture according to their respective pI values, focusing the proteins at these points and compressing them into very narrow zones.
The schematic representation of protein migration during IEF and the apparatus used for IEF are shown in Figs. 4.9 and 4.10, respectively.

Fig. 4.9 Schematic diagram of the migration process for proteins with different pI values in an electric field
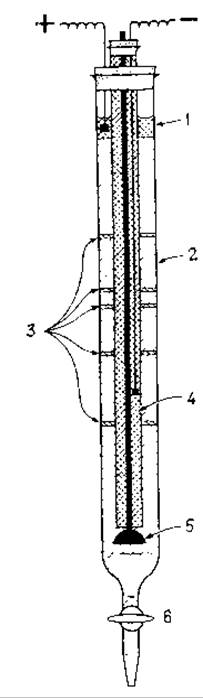
Fig. 4.10 Schematic diagram of the setup for protein isoelectric focusing
1. phosphoric acid;
2. ampholyte + sucrose, establishing the pH and density gradient of the medium
3. localization zones of proteins with different pI values after the completion of the IEF process
4. cathode tube filled with triethanolamine
5. shut-off valve
6. drain cock
The fundamental laws governing the IEF process are described by the Svensson equation:
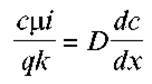
where c is concentration; μ is mobility; i is current; k is conductivity; q is the cross-sectional area of the column; D is the diffusion coefficient; x is the coordinate along the column axis in the direction from the anode to the cathode.
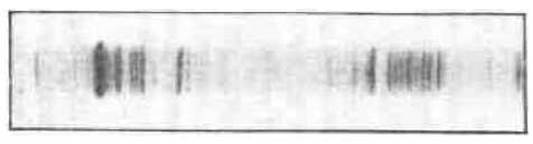
Below is a photograph showing an example of the analysis result of a complex protein mixture using IEF after gel staining.
Last update: 06/08/2026
Editorial and Educational Adaptation: This material has been compiled based on the primary/original source text. The project team performed an editorial review, corrected technical inaccuracies, structured sections, and adapted the content for an educational format.
What was processed:
- elimination of formatting defects (OCR errors, structural breaks, corrupted characters);
- editorial organization of content;
- standardization of terminology in accordance with academic sources;
- verification of factual statements against the original source text.
All mentions of the author, publication year, and origin of the primary text have been preserved in accordance with the source.